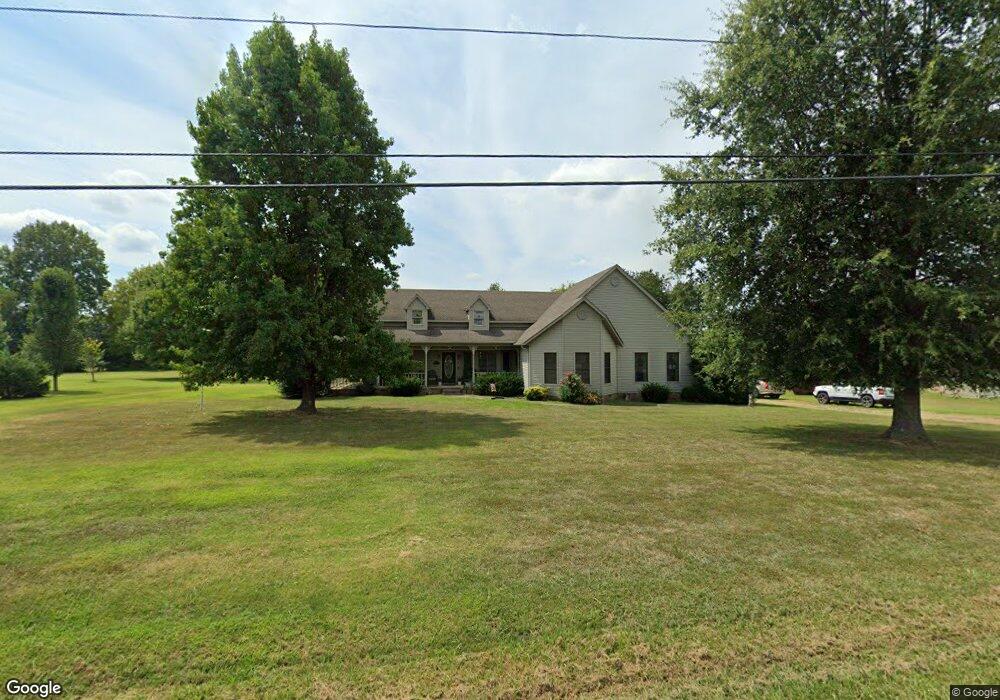
1020 Forest Crossing Joelton, TN 37080
Joelton NeighborhoodEstimated Value: $400,000 - $441,000
--
Bed
2
Baths
1,868
Sq Ft
$222/Sq Ft
Est. Value
About This Home
This home is located at 1020 Forest Crossing, Joelton, TN 37080 and is currently estimated at $413,899, approximately $221 per square foot. 1020 Forest Crossing is a home located in Cheatham County with nearby schools including East Cheatham Elementary School, Cheatham Middle School, and Sycamore High School.
Ownership History
Date
Name
Owned For
Owner Type
Purchase Details
Closed on
Oct 27, 2010
Sold by
Harrison John
Bought by
Petrino Mary Ann
Current Estimated Value
Home Financials for this Owner
Home Financials are based on the most recent Mortgage that was taken out on this home.
Original Mortgage
$154,404
Outstanding Balance
$102,392
Interest Rate
4.37%
Estimated Equity
$311,508
Purchase Details
Closed on
Aug 12, 2010
Sold by
Young David L
Bought by
Harrison John
Purchase Details
Closed on
Jun 30, 2010
Sold by
Long Kenneth W
Bought by
Young David L
Purchase Details
Closed on
Sep 28, 1992
Bought by
Long Kenneth W and Long Debra F
Purchase Details
Closed on
Sep 30, 1991
Bought by
Long Kenneth W
Purchase Details
Closed on
Aug 10, 1989
Bought by
C D R Development Inc
Create a Home Valuation Report for This Property
The Home Valuation Report is an in-depth analysis detailing your home's value as well as a comparison with similar homes in the area
Home Values in the Area
Average Home Value in this Area
Purchase History
| Date | Buyer | Sale Price | Title Company |
|---|---|---|---|
| Petrino Mary Ann | $149,000 | -- | |
| Harrison John | $130,000 | -- | |
| Young David L | $105,000 | -- | |
| Long Kenneth W | $106,000 | -- | |
| Long Kenneth W | $14,000 | -- | |
| C D R Development Inc | -- | -- |
Source: Public Records
Mortgage History
| Date | Status | Borrower | Loan Amount |
|---|---|---|---|
| Open | C D R Development Inc | $154,404 |
Source: Public Records
Tax History Compared to Growth
Tax History
| Year | Tax Paid | Tax Assessment Tax Assessment Total Assessment is a certain percentage of the fair market value that is determined by local assessors to be the total taxable value of land and additions on the property. | Land | Improvement |
|---|---|---|---|---|
| 2024 | $1,913 | $110,525 | $16,325 | $94,200 |
| 2023 | $1,872 | $65,750 | $6,875 | $58,875 |
| 2022 | $1,769 | $65,750 | $6,875 | $58,875 |
| 2021 | $1,769 | $65,750 | $6,875 | $58,875 |
| 2020 | $1,769 | $65,750 | $6,875 | $58,875 |
| 2019 | $1,769 | $65,750 | $6,875 | $58,875 |
| 2018 | $1,841 | $58,650 | $6,250 | $52,400 |
| 2017 | $1,741 | $58,650 | $6,250 | $52,400 |
| 2016 | $1,657 | $58,650 | $6,250 | $52,400 |
| 2015 | $1,338 | $44,300 | $6,250 | $38,050 |
| 2014 | $1,338 | $44,300 | $6,250 | $38,050 |
Source: Public Records
Map
Nearby Homes
- 1086 Jason Cir
- 0 Old Clarksville Pike Unit RTC3017253
- 1001 Homestead Trail
- 6838 Old Clarksville Pike
- 1068 Carl Perry Rd
- 1061 N Fork Dr
- 5511 Highway 41a
- 0 W Side Rd Unit RTC2756551
- 0 Morgan Unit RTC2905012
- 1055 Mead Dr
- 1051 Jacobs Valley Rd
- 1120 Jacobs Ct
- 1010 Cherokee Ct
- 0 Fox Dr Unit RTC2538178
- 0 Fox Dr Unit RTC2538177
- 0 Fox Dr Unit RTC2538176
- 0 Fox Dr Unit RTC2538175
- 0 Fox Dr Unit RTC2538174
- 0 Fox Dr Unit RTC2538173
- 0 Fox Dr Unit RTC2538172
- 1026 Forest Crossing
- 1014 Forest Crossing
- 1002 Devon Place
- 1032 Forest Crossing
- 1029 Oakwood Rd
- 1035 Oakwood Rd
- 1008 Forest Crossing
- 1007 Forest Crossing
- 1023 Oakwood Rd
- 1031 Forest Crossing
- 1015 Oakwood Rd
- 1008 Devon Place
- 1038 Forest Crossing
- 1004 Forest Crossing
- 1043 Oakwood Rd
- 1007 Devon Place
- 1011 Oakwood Rd
- 1003 Forest Crossing
- 1053 Oakwood Rd
- 1014 Devon Place