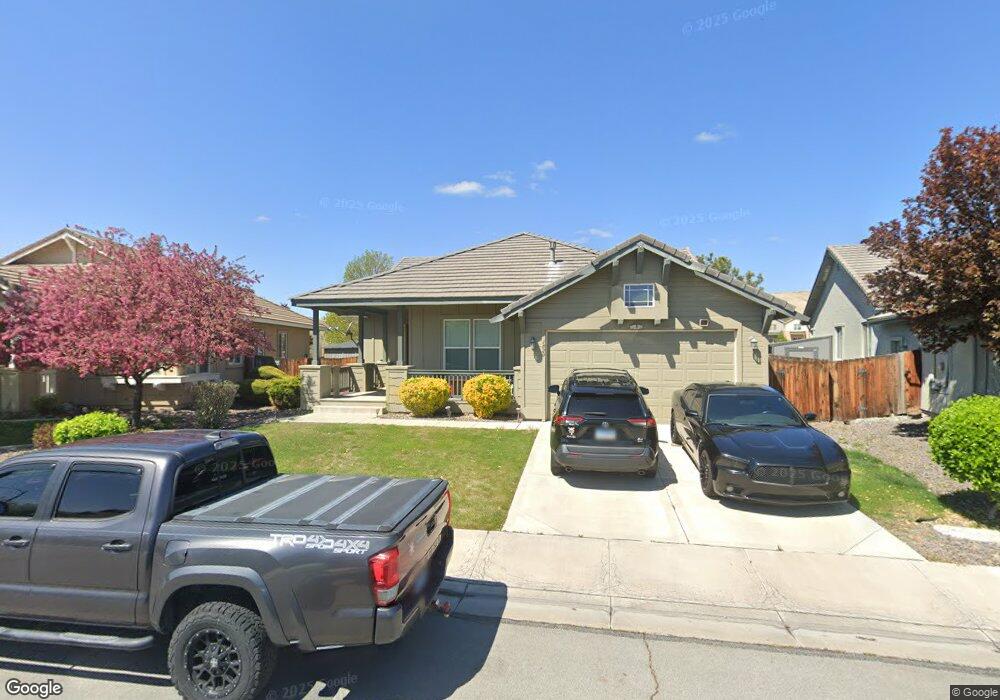
1020 Harbor Town Cir Unit 4 Sparks, NV 89436
Los Altos Parkway NeighborhoodEstimated Value: $555,000 - $562,535
3
Beds
2
Baths
1,932
Sq Ft
$289/Sq Ft
Est. Value
About This Home
This home is located at 1020 Harbor Town Cir Unit 4, Sparks, NV 89436 and is currently estimated at $558,134, approximately $288 per square foot. 1020 Harbor Town Cir Unit 4 is a home located in Washoe County with nearby schools including Miguel Sepulveda Elementary School, Sky Ranch Middle School, and Edward C Reed High School.
Ownership History
Date
Name
Owned For
Owner Type
Purchase Details
Closed on
Dec 20, 2016
Sold by
Clark David W and Clark Susan R
Bought by
Cabales Mar and Cabales Theresa
Current Estimated Value
Home Financials for this Owner
Home Financials are based on the most recent Mortgage that was taken out on this home.
Original Mortgage
$265,500
Interest Rate
3.57%
Mortgage Type
New Conventional
Purchase Details
Closed on
Nov 4, 2003
Sold by
Sparks Development Llc
Bought by
Clark David W and Clark Sue R
Home Financials for this Owner
Home Financials are based on the most recent Mortgage that was taken out on this home.
Original Mortgage
$241,200
Interest Rate
6.5%
Mortgage Type
Unknown
Create a Home Valuation Report for This Property
The Home Valuation Report is an in-depth analysis detailing your home's value as well as a comparison with similar homes in the area
Home Values in the Area
Average Home Value in this Area
Purchase History
| Date | Buyer | Sale Price | Title Company |
|---|---|---|---|
| Cabales Mar | $295,000 | First Centennial Reno | |
| Clark David W | $733,900 | First American Title |
Source: Public Records
Mortgage History
| Date | Status | Borrower | Loan Amount |
|---|---|---|---|
| Previous Owner | Cabales Mar | $265,500 | |
| Previous Owner | Clark David W | $241,200 |
Source: Public Records
Tax History Compared to Growth
Tax History
| Year | Tax Paid | Tax Assessment Tax Assessment Total Assessment is a certain percentage of the fair market value that is determined by local assessors to be the total taxable value of land and additions on the property. | Land | Improvement |
|---|---|---|---|---|
| 2025 | $2,992 | $131,015 | $42,424 | $88,591 |
| 2024 | $2,992 | $125,069 | $35,784 | $89,285 |
| 2023 | $2,906 | $124,526 | $40,089 | $84,437 |
| 2022 | $2,823 | $103,979 | $33,730 | $70,249 |
| 2021 | $2,742 | $97,375 | $27,528 | $69,847 |
| 2020 | $2,660 | $96,783 | $26,835 | $69,948 |
| 2019 | $2,583 | $94,925 | $27,652 | $67,273 |
| 2018 | $2,508 | $86,955 | $21,126 | $65,829 |
| 2017 | $2,435 | $87,472 | $21,476 | $65,996 |
| 2016 | $2,372 | $86,617 | $19,338 | $67,279 |
| 2015 | $2,372 | $87,872 | $21,053 | $66,819 |
| 2014 | $2,299 | $73,301 | $18,585 | $54,716 |
| 2013 | -- | $60,589 | $13,808 | $46,781 |
Source: Public Records
Map
Nearby Homes
- 5651 Hunting Creek Way
- 2084 Great Bluffs Ln Unit Homesite 5132
- 2094 Great Bluffs Ln Unit Homesite 5133
- 7129 Singing Tree Rd Unit Homesite 5121
- 585 Sonora Pass Ct
- 941 Silver Coyote Dr
- 1196 Turnberry Dr
- 521 E Equinox Peak Ct
- 521 E Equinox Peak Ct Unit Homesite 2038
- 532 E Equinox Peak Ct Unit Homesite 2045
- 551 E Equinox Peak Ct
- 551 E Equinox Peak Ct Unit Homesite 2035
- 601 W Equinox Peak Ct
- 601 W Equinox Peak Ct Unit Homesite 2030
- 650 Panama Dr
- 7290 Pah Rah Dr
- 1760 Eagle Pass Rd Unit Homesite 1117
- 1700 Eagle Pass Rd Unit Homesite 1109
- 1744 Eagle Pass Rd Unit Homesite 1115
- 1790 Eagle Pass Rd Unit Homesite 1120
- 1024 Harbor Town Cir
- 1016 Harbor Town Cir
- 1028 Harbor Town Cir
- 1012 Harbor Town Cir Unit 4
- 1017 Harbor Town Cir
- 1023 Harbor Town Cir Unit 4
- 1032 Harbor Town Cir
- 1008 Harbor Town Cir
- 5650 Sawgrass Ct
- 1009 Harbor Town Cir Unit 4
- 1031 Harbor Town Cir
- 5645 Sawgrass Ct
- 1036 Harbor Town Cir Unit 4
- 1004 Harbor Town Cir
- 1003 Harbor Town Cir Unit 4
- 1038 Tyrall Ct
- 1039 Harbor Town Cir
- 5640 Sawgrass Ct Unit 1
- 1030 Tyrall Ct Unit 4
- 1040 Harbor Town Cir