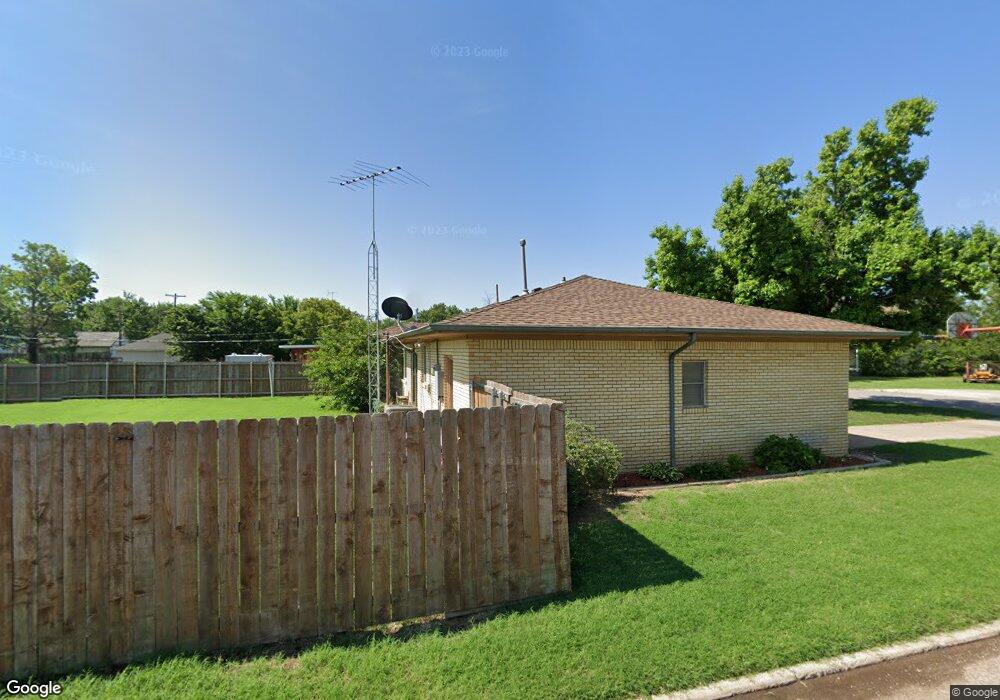
1020 N Leach Ave Watonga, OK 73772
Estimated Value: $97,000 - $129,827
3
Beds
2
Baths
1,540
Sq Ft
$74/Sq Ft
Est. Value
About This Home
This home is located at 1020 N Leach Ave, Watonga, OK 73772 and is currently estimated at $113,707, approximately $73 per square foot. 1020 N Leach Ave is a home located in Blaine County with nearby schools including Watonga Elementary School, Watonga Middle School, and Watonga High School.
Ownership History
Date
Name
Owned For
Owner Type
Purchase Details
Closed on
Jul 28, 2025
Sold by
Ray Ty and Ray Toni
Bought by
Houston Kendra Shae
Current Estimated Value
Home Financials for this Owner
Home Financials are based on the most recent Mortgage that was taken out on this home.
Original Mortgage
$108,007
Outstanding Balance
$107,916
Interest Rate
6.84%
Mortgage Type
FHA
Estimated Equity
$5,791
Purchase Details
Closed on
Jul 6, 2023
Sold by
Ray Cathy A and Ray Cathy Ann
Bought by
Ray Cathy A and Ray Cathy Ann
Purchase Details
Closed on
Mar 8, 2019
Sold by
Ray Cathy A and Ray Cathy
Bought by
Ray Cathy and Ray Cathy A
Purchase Details
Closed on
Jan 2, 1992
Sold by
Bouher Martha
Bought by
Ray Ricky and Ray Cathy
Create a Home Valuation Report for This Property
The Home Valuation Report is an in-depth analysis detailing your home's value as well as a comparison with similar homes in the area
Home Values in the Area
Average Home Value in this Area
Purchase History
| Date | Buyer | Sale Price | Title Company |
|---|---|---|---|
| Houston Kendra Shae | $110,000 | None Listed On Document | |
| Houston Kendra Shae | $110,000 | None Listed On Document | |
| Ray Cathy A | -- | None Listed On Document | |
| Ray Cathy A | -- | None Listed On Document | |
| Ray Cathy | -- | None Listed On Document | |
| Ray Cathy | -- | None Listed On Document | |
| Ray Cathy | -- | None Listed On Document | |
| Ray Cathy | -- | None Listed On Document | |
| Ray Ricky | $35,000 | -- |
Source: Public Records
Mortgage History
| Date | Status | Borrower | Loan Amount |
|---|---|---|---|
| Open | Houston Kendra Shae | $108,007 | |
| Closed | Houston Kendra Shae | $108,007 |
Source: Public Records
Tax History Compared to Growth
Tax History
| Year | Tax Paid | Tax Assessment Tax Assessment Total Assessment is a certain percentage of the fair market value that is determined by local assessors to be the total taxable value of land and additions on the property. | Land | Improvement |
|---|---|---|---|---|
| 2024 | $745 | $7,667 | $762 | $6,905 |
| 2023 | $613 | $7,302 | $762 | $6,540 |
| 2022 | $662 | $7,089 | $762 | $6,327 |
| 2021 | $599 | $7,089 | $762 | $6,327 |
| 2020 | $614 | $7,312 | $762 | $6,550 |
| 2019 | $644 | $7,489 | $762 | $6,727 |
| 2018 | $661 | $7,387 | $1,044 | $6,343 |
| 2017 | $657 | $7,172 | $462 | $6,710 |
| 2016 | $520 | $5,596 | $462 | $5,134 |
| 2015 | $447 | $5,434 | $462 | $4,972 |
| 2014 | $344 | $5,276 | $462 | $4,814 |
Source: Public Records
Map
Nearby Homes
- 1017 N Prouty Ave
- 524 Skyview Dr
- 815 N Prouty Ave
- 1100 N Weigle Ave
- 501 Northampton Dr
- 518 Sunset Dr
- 704 N Prouty Ave
- 900 N Burford Ave
- 101 E 5th St Unit 103 E 5th St
- 834 Mimosa Dr
- 710 N Forrest Ave
- 515 N Burford Ave
- 711 Villa Place Unit 181A
- 401 N Leach Ave
- 100 W 3rd St
- 319 N Wikoff Ave
- 416 N Burford Ave
- 409 W 3rd St
- 411 N Forrest Ave
- 720 W 3rd St
- 1018 N Leach Ave
- 214 W 10th St
- 1021 N Prouty Ave
- 212 W 10th St
- 210 W 9th St
- 210 W 10th St
- 212 W 9th St
- 1021 N Leach Ave
- 1019 N Leach Ave
- 1105 N Prouty Ave
- 1101 N Leach Ave
- 190-34 Rr 1
- 1118 N Leach Ave
- 1005 N Leach Ave
- 1111 N Prouty Ave
- 1003 N Prouty Ave
- 1120 N Leach Ave
- 1001 N Leach Ave
- 131 Rr 3
- 132 Rr 3