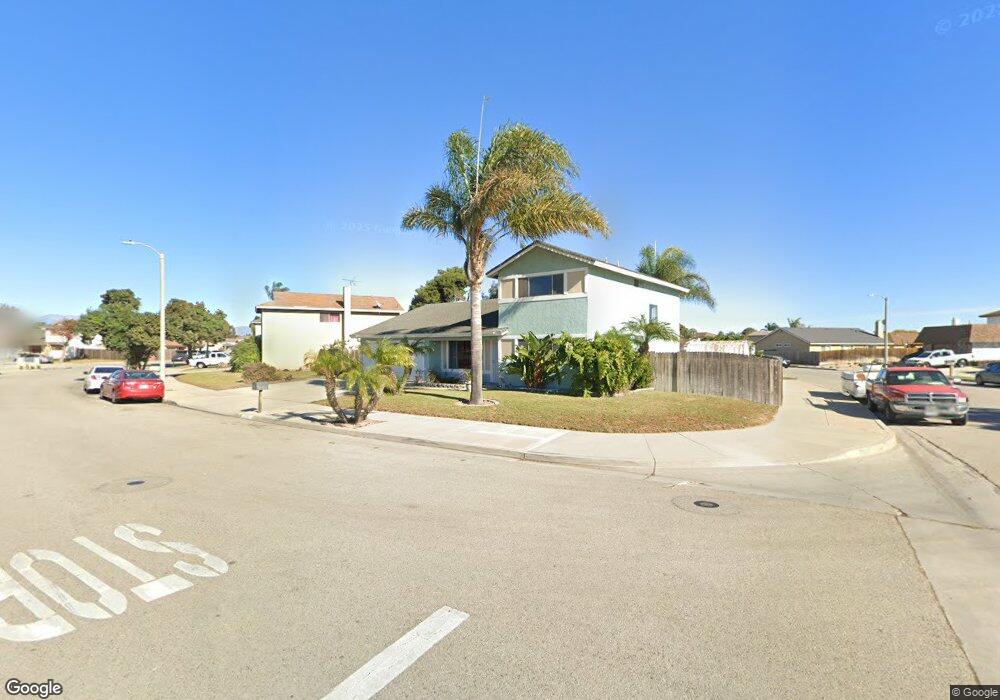
1020 Oarfish Ln Oxnard, CA 93035
Sea View Estates NeighborhoodEstimated Value: $836,000 - $888,513
4
Beds
2
Baths
1,842
Sq Ft
$467/Sq Ft
Est. Value
About This Home
This home is located at 1020 Oarfish Ln, Oxnard, CA 93035 and is currently estimated at $861,128, approximately $467 per square foot. 1020 Oarfish Ln is a home located in Ventura County with nearby schools including Juan Lagunas Soria Elementary School and Oxnard High School.
Ownership History
Date
Name
Owned For
Owner Type
Purchase Details
Closed on
Oct 20, 2021
Sold by
Dickey Bryan K and Dickey Christine E
Bought by
Dickey Bryan K and Dickey Christine E
Current Estimated Value
Home Financials for this Owner
Home Financials are based on the most recent Mortgage that was taken out on this home.
Original Mortgage
$558,000
Outstanding Balance
$466,635
Interest Rate
2.88%
Mortgage Type
New Conventional
Estimated Equity
$394,493
Purchase Details
Closed on
Apr 28, 2021
Sold by
Dickey Bryan K and Dickey Christine E
Bought by
Dickey Bryan and Dickey Christine
Purchase Details
Closed on
Jun 8, 2001
Sold by
Jean W Brennan Family Trust and Brennan Jean W
Bought by
Dickey Bryan K and Dickey Christine E
Home Financials for this Owner
Home Financials are based on the most recent Mortgage that was taken out on this home.
Original Mortgage
$225,250
Interest Rate
7.09%
Purchase Details
Closed on
Jun 11, 1989
Sold by
Brennan Jean W
Bought by
Brennan Jean W
Create a Home Valuation Report for This Property
The Home Valuation Report is an in-depth analysis detailing your home's value as well as a comparison with similar homes in the area
Home Values in the Area
Average Home Value in this Area
Purchase History
| Date | Buyer | Sale Price | Title Company |
|---|---|---|---|
| Dickey Bryan K | -- | Amrock Inc | |
| Dickey Bryan | -- | Amrock Inc | |
| Dickey Bryan | -- | None Available | |
| Dickey Bryan K | $271,500 | First American Title Co | |
| Brennan Jean W | -- | -- |
Source: Public Records
Mortgage History
| Date | Status | Borrower | Loan Amount |
|---|---|---|---|
| Open | Dickey Bryan K | $558,000 | |
| Previous Owner | Dickey Bryan K | $225,250 |
Source: Public Records
Tax History
| Year | Tax Paid | Tax Assessment Tax Assessment Total Assessment is a certain percentage of the fair market value that is determined by local assessors to be the total taxable value of land and additions on the property. | Land | Improvement |
|---|---|---|---|---|
| 2025 | $4,805 | $400,620 | $160,245 | $240,375 |
| 2024 | $4,805 | $392,765 | $157,103 | $235,662 |
| 2023 | $4,629 | $385,064 | $154,022 | $231,042 |
| 2022 | $4,489 | $377,514 | $151,002 | $226,512 |
| 2021 | $4,451 | $370,112 | $148,041 | $222,071 |
| 2020 | $4,533 | $366,319 | $146,524 | $219,795 |
| 2019 | $4,404 | $359,137 | $143,651 | $215,486 |
| 2018 | $4,341 | $352,096 | $140,835 | $211,261 |
| 2017 | $4,119 | $345,193 | $138,074 | $207,119 |
| 2016 | $3,975 | $338,425 | $135,367 | $203,058 |
| 2015 | $4,015 | $333,344 | $133,335 | $200,009 |
| 2014 | -- | $326,816 | $130,724 | $196,092 |
Source: Public Records
Map
Nearby Homes
- 3746 Dunkirk Dr
- 4060 Tradewinds Dr
- 3800 Alee Ln
- 1437 Windshore Way
- 1423 Windshore Way
- 1421 Windshore Way
- 1503 Windshore Way
- 1541 Windshore Way
- 1506 Seabridge Ln
- 1423 Caspian Way
- 1365 Donegal Way
- 4234 Tradewinds Dr
- 2919 Naples Dr
- 2923 Kelp Ln Unit 11
- 4114 Caribbean St
- 1170 Windward Way
- 4312 Waterside Ln
- 4344 Tradewinds Dr
- 4320 Waterside Ln
- 1464 Twin Tides Place
- 3745 Pier Walk
- 1010 Oarfish Ln
- 3741 Pier Walk
- 1000 Oarfish Ln
- 1025 Oarfish Ln
- 3760 Pier Walk
- 3750 Pier Walk
- 1021 Oarfish Ln
- 3744 Pier Walk
- 1011 Oarfish Ln
- 3731 Pier Walk
- 3760 Oarfish Ln
- 1041 Oarfish Ln
- 1005 Oarfish Ln
- 3720 Taffrail Ln
- 3740 Pier Walk
- 1001 Oarfish Ln
- 1051 Oarfish Ln
- 3751 Tiller Dr
- 3721 Pier Walk
Your Personal Tour Guide
Ask me questions while you tour the home.