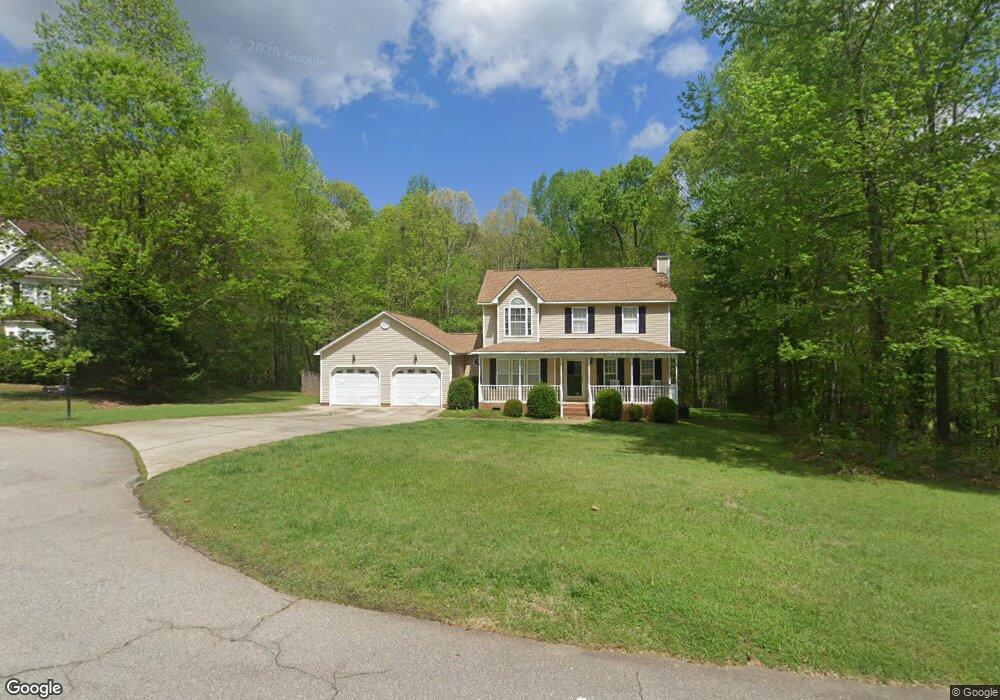
1020 Panther Springs Ct Raleigh, NC 27603
Estimated Value: $377,000 - $439,000
3
Beds
3
Baths
1,600
Sq Ft
$253/Sq Ft
Est. Value
About This Home
This home is located at 1020 Panther Springs Ct, Raleigh, NC 27603 and is currently estimated at $404,656, approximately $252 per square foot. 1020 Panther Springs Ct is a home located in Wake County with nearby schools including Banks Road Elementary School.
Ownership History
Date
Name
Owned For
Owner Type
Purchase Details
Closed on
Jan 25, 2010
Sold by
Federal Home Loan Mortgage Corporation
Bought by
Cartrette Shannon
Current Estimated Value
Home Financials for this Owner
Home Financials are based on the most recent Mortgage that was taken out on this home.
Original Mortgage
$144,400
Outstanding Balance
$95,521
Interest Rate
5.02%
Mortgage Type
New Conventional
Estimated Equity
$309,135
Purchase Details
Closed on
Jun 12, 2009
Sold by
Durbal Ravi and Durbal Jennifer
Bought by
Federal Home Loan Mortgage Corporation
Purchase Details
Closed on
Nov 10, 2005
Sold by
Comfort Homes Inc
Bought by
Durbal Ravi and Durbal Jennifer
Home Financials for this Owner
Home Financials are based on the most recent Mortgage that was taken out on this home.
Original Mortgage
$144,810
Interest Rate
5.84%
Mortgage Type
Fannie Mae Freddie Mac
Create a Home Valuation Report for This Property
The Home Valuation Report is an in-depth analysis detailing your home's value as well as a comparison with similar homes in the area
Home Values in the Area
Average Home Value in this Area
Purchase History
| Date | Buyer | Sale Price | Title Company |
|---|---|---|---|
| Cartrette Shannon | -- | None Available | |
| Federal Home Loan Mortgage Corporation | $147,798 | None Available | |
| Durbal Ravi | $161,000 | None Available |
Source: Public Records
Mortgage History
| Date | Status | Borrower | Loan Amount |
|---|---|---|---|
| Open | Cartrette Shannon | $144,400 | |
| Previous Owner | Durbal Ravi | $144,810 |
Source: Public Records
Tax History Compared to Growth
Tax History
| Year | Tax Paid | Tax Assessment Tax Assessment Total Assessment is a certain percentage of the fair market value that is determined by local assessors to be the total taxable value of land and additions on the property. | Land | Improvement |
|---|---|---|---|---|
| 2025 | $2,468 | $382,785 | $80,000 | $302,785 |
| 2024 | $2,397 | $382,785 | $80,000 | $302,785 |
| 2023 | $1,902 | $241,417 | $42,000 | $199,417 |
| 2022 | $1,764 | $241,417 | $42,000 | $199,417 |
| 2021 | $1,716 | $241,417 | $42,000 | $199,417 |
| 2020 | $1,688 | $241,417 | $42,000 | $199,417 |
| 2019 | $1,653 | $199,915 | $38,000 | $161,915 |
| 2018 | $1,520 | $199,915 | $38,000 | $161,915 |
| 2017 | $1,441 | $199,915 | $38,000 | $161,915 |
| 2016 | $1,412 | $199,915 | $38,000 | $161,915 |
| 2015 | $1,261 | $178,735 | $38,000 | $140,735 |
| 2014 | $1,196 | $178,735 | $38,000 | $140,735 |
Source: Public Records
Map
Nearby Homes
- 10329 Fanny Brown Rd
- 5216 Relay Way
- 1117 Leach St
- 3205 Banks Rd
- 2704 Stageline Dr
- 9008 Chelsea Dr
- 4008 Bankshire Ln
- 2600 Banks Rd Unit Lot 2
- 2600 Banks Rd Unit Lot 1
- 5512 Glenhurst North Dr
- 3320 Highgate Rd
- 4012 Sorrell Brothers Ct
- 4824 Bristol Meadow Dr
- 9045 Chelsea Dr
- 1425 Tawny View Ln
- 5060 Trotter Dr
- 1200 Misty Morning Way
- 5057 Trotter Dr
- 1329 Wynncrest Ct
- 1017 Widgeon Way
- 1024 Panther Springs Ct
- 1016 Panther Springs Ct
- 1013 Panther Springs Ct
- 1025 Panther Springs Ct
- 5100 Turning Branch Ln
- 1012 Panther Springs Ct
- 1017 Panther Springs Ct
- 1021 Panther Springs Ct
- 5101 Turning Branch Ln
- 10421 Fanny Brown Rd
- 1008 Panther Springs Ct
- 2808 Oris Dr
- 5108 Turning Branch Ln
- 1009 Panther Springs Ct
- 5200 Turning Branch Ln
- 10425 Fanny Brown Rd
- 5201 Turning Branch Ln
- 10413 Fanny Brown Rd
- 1004 Panther Springs Ct
- 10417 Fanny Brown Rd