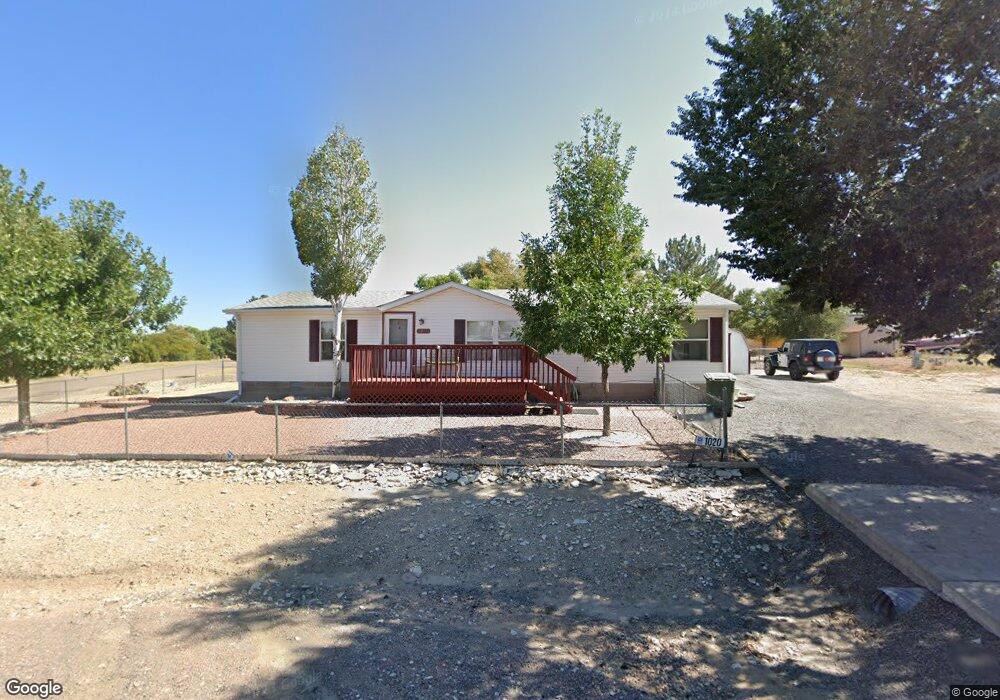
1020 S Blueridge Dr Pueblo, CO 81007
Estimated Value: $206,000 - $271,000
3
Beds
2
Baths
1,404
Sq Ft
$166/Sq Ft
Est. Value
About This Home
This home is located at 1020 S Blueridge Dr, Pueblo, CO 81007 and is currently estimated at $232,667, approximately $165 per square foot. 1020 S Blueridge Dr is a home located in Pueblo County with nearby schools including Desert Sage Elementary School, Liberty Point International School, and Pueblo West High School.
Ownership History
Date
Name
Owned For
Owner Type
Purchase Details
Closed on
Feb 7, 2024
Sold by
Porter William and Porter Katheryn A
Bought by
Porter William and Porter Katheryn A
Current Estimated Value
Purchase Details
Closed on
Nov 4, 2008
Sold by
Green Tree Servicing Llc
Bought by
Porter William and Porter Katheryn A
Purchase Details
Closed on
Jun 26, 2008
Sold by
Oldham Peggy J
Bought by
Green Tree Servicing Llc
Purchase Details
Closed on
Sep 10, 1997
Sold by
Hankins Joe R + Dale L
Bought by
Oldham Peggy J
Purchase Details
Closed on
Aug 5, 1994
Sold by
Real Estate Exchange Ltd
Bought by
Hankins Joe R + Dale L
Purchase Details
Closed on
May 10, 1994
Sold by
Neuburger Maurice E Tr
Bought by
Real Estate Exchange Ltd
Purchase Details
Closed on
Apr 1, 1986
Sold by
Neuburger Maurice E
Bought by
Neuburger Maurice E Tr
Purchase Details
Closed on
Aug 15, 1977
Sold by
Lawyers Title Of Pueblo Tr
Bought by
Neuburger Maurice E
Create a Home Valuation Report for This Property
The Home Valuation Report is an in-depth analysis detailing your home's value as well as a comparison with similar homes in the area
Home Values in the Area
Average Home Value in this Area
Purchase History
| Date | Buyer | Sale Price | Title Company |
|---|---|---|---|
| Porter William | -- | None Listed On Document | |
| Porter William | $69,995 | None Available | |
| Green Tree Servicing Llc | -- | None Available | |
| Oldham Peggy J | $12,000 | -- | |
| Hankins Joe R + Dale L | $16,300 | -- | |
| Real Estate Exchange Ltd | -- | -- | |
| Neuburger Maurice E Tr | -- | -- | |
| Neuburger Maurice E | $7,000 | -- |
Source: Public Records
Tax History Compared to Growth
Tax History
| Year | Tax Paid | Tax Assessment Tax Assessment Total Assessment is a certain percentage of the fair market value that is determined by local assessors to be the total taxable value of land and additions on the property. | Land | Improvement |
|---|---|---|---|---|
| 2024 | $512 | $9,990 | -- | -- |
| 2023 | $518 | $13,670 | $1,840 | $11,830 |
| 2022 | $485 | $9,540 | $1,910 | $7,630 |
| 2021 | $497 | $9,820 | $1,970 | $7,850 |
| 2020 | $379 | $9,820 | $1,970 | $7,850 |
| 2019 | $378 | $7,461 | $965 | $6,496 |
| 2018 | $558 | $5,578 | $972 | $4,606 |
| 2017 | $558 | $5,578 | $972 | $4,606 |
| 2016 | $544 | $5,446 | $1,075 | $4,371 |
| 2015 | $508 | $5,446 | $1,075 | $4,371 |
| 2014 | $508 | $5,120 | $1,075 | $4,045 |
Source: Public Records
Map
Nearby Homes
- 979 S Dawnview Dr
- 997 S Silt Dr
- 952 S Tolstoi Dr
- 992 S Saki Dr
- 129 E Countryside Dr
- 219 E Linden Ave
- 249 E Linden Ave
- 88 E Hemlock Dr
- 235 E Cellini Dr
- 113 E Homer Dr
- 349 E Greenway Dr Unit 11
- 880 S Dante Dr
- 192 E Kipling Dr
- 108 E Kipling Dr
- 971 Acreview Dr
- 365 E Greenway Dr
- 1087 S Greenway Dr
- 181 E Kipling Dr
- 890 S Cellini Plaza
- 128 E Byrd Dr
- 1038 S Saddlerock Dr
- 1019 S Blueridge Dr
- 160 E Dawnview Dr
- 160 E Dawnview Dr Unit 1
- 1042 S Saddlerock Dr
- 1027 S Blueridge Dr
- 995 S Dawnview Dr
- 0 S Saddlerock Dr
- 168 E Dawnview Dr
- 997 S Blueridge Dr
- 1050 S Saddlerock Dr
- 991 S Dawnview Dr
- 1020 S Saddlerock Dr
- 1036 S Blueridge Dr
- 1043 S Saddlerock Dr
- 981 S Blueridge Dr
- 184 E Dawnview Dr
- 987 S Dawnview Dr
- 1047 S Saddlerock Dr
- 1014 S Saddlerock Dr