Estimated Value: $139,000 - $284,000
4
Beds
2
Baths
2,262
Sq Ft
$81/Sq Ft
Est. Value
About This Home
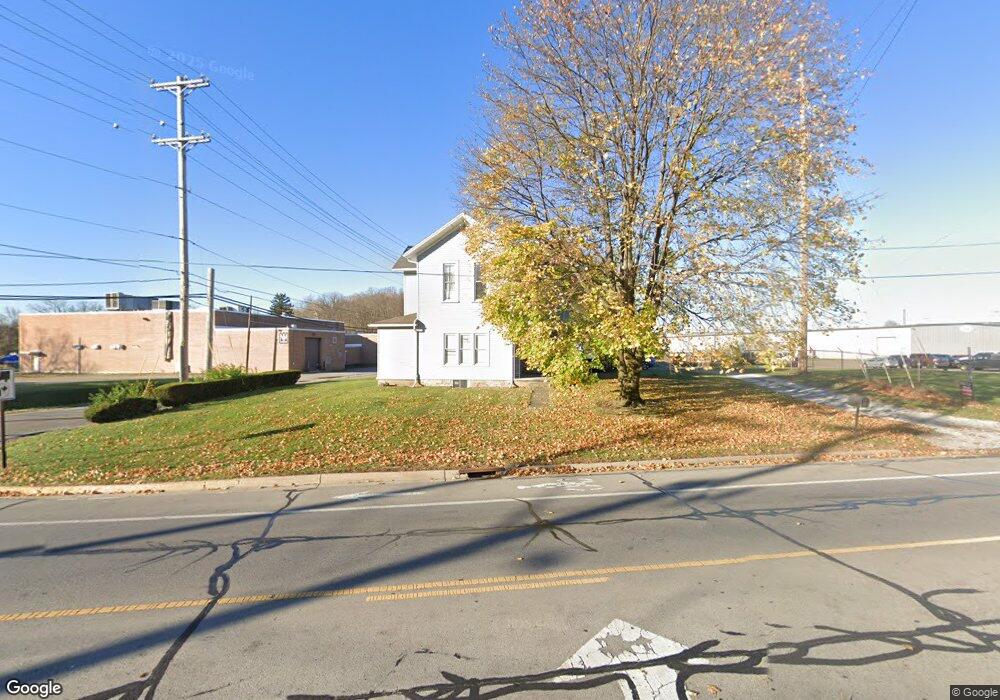
This home is located at 1020 S Main St, Piqua, OH 45356 and is currently estimated at $184,010, approximately $81 per square foot. 1020 S Main St is a home located in Miami County with nearby schools including Piqua Junior High School, Piqua High School, and Nicholas School.
Ownership History
Date
Name
Owned For
Owner Type
Purchase Details
Closed on
Oct 30, 2019
Sold by
Drake Roxanne T
Bought by
Cantrell Seth T
Current Estimated Value
Home Financials for this Owner
Home Financials are based on the most recent Mortgage that was taken out on this home.
Original Mortgage
$71,677
Outstanding Balance
$64,023
Interest Rate
4.4%
Mortgage Type
FHA
Estimated Equity
$119,987
Purchase Details
Closed on
Jan 13, 2015
Sold by
Reed Delbert Eugene
Bought by
Drake Roxanne T
Purchase Details
Closed on
Oct 1, 1981
Bought by
Basham Willie
Create a Home Valuation Report for This Property
The Home Valuation Report is an in-depth analysis detailing your home's value as well as a comparison with similar homes in the area
Home Values in the Area
Average Home Value in this Area
Purchase History
| Date | Buyer | Sale Price | Title Company |
|---|---|---|---|
| Cantrell Seth T | $73,000 | None Available | |
| Drake Roxanne T | $55,000 | Attorney | |
| Basham Willie | $40,000 | -- |
Source: Public Records
Mortgage History
| Date | Status | Borrower | Loan Amount |
|---|---|---|---|
| Open | Cantrell Seth T | $71,677 |
Source: Public Records
Tax History Compared to Growth
Tax History
| Year | Tax Paid | Tax Assessment Tax Assessment Total Assessment is a certain percentage of the fair market value that is determined by local assessors to be the total taxable value of land and additions on the property. | Land | Improvement |
|---|---|---|---|---|
| 2024 | $1,375 | $32,560 | $8,370 | $24,190 |
| 2023 | $1,375 | $32,560 | $8,370 | $24,190 |
| 2022 | $1,382 | $32,560 | $8,370 | $24,190 |
| 2021 | $1,122 | $24,120 | $6,200 | $17,920 |
| 2020 | $1,100 | $24,120 | $6,200 | $17,920 |
| 2019 | $1,132 | $24,120 | $6,200 | $17,920 |
| 2018 | $1,174 | $24,440 | $6,200 | $18,240 |
| 2017 | $1,187 | $24,440 | $6,200 | $18,240 |
| 2016 | $1,174 | $24,440 | $6,200 | $18,240 |
| 2015 | $778 | $24,440 | $6,200 | $18,240 |
| 2014 | $778 | $24,440 | $6,200 | $18,240 |
| 2013 | $780 | $24,440 | $6,200 | $18,240 |
Source: Public Records
Map
Nearby Homes
- 0 Hemm Rd
- 205 Hemm Rd
- 0 N County Road 25a Unit 285958
- 0 N County Road 25a Unit 285960
- 0 N County Road 25a Unit 283087
- 0 N County Road 25a Unit 283086
- 0 N County Road 25a Unit 282861
- 0 N County Road 25a Unit 282847
- 0 N County Road 25a Unit 276139
- 200 Hemm Rd
- 207 Hemm Rd
- 211 Hemm Rd
- 1302 S Main St
- 0 Clark Ave
- 915 S Downing St
- 2120 Hemm Rd
- 2090 Hemm Rd
- 817 S Main St
- 125 Bridge St
- 811 S Main St