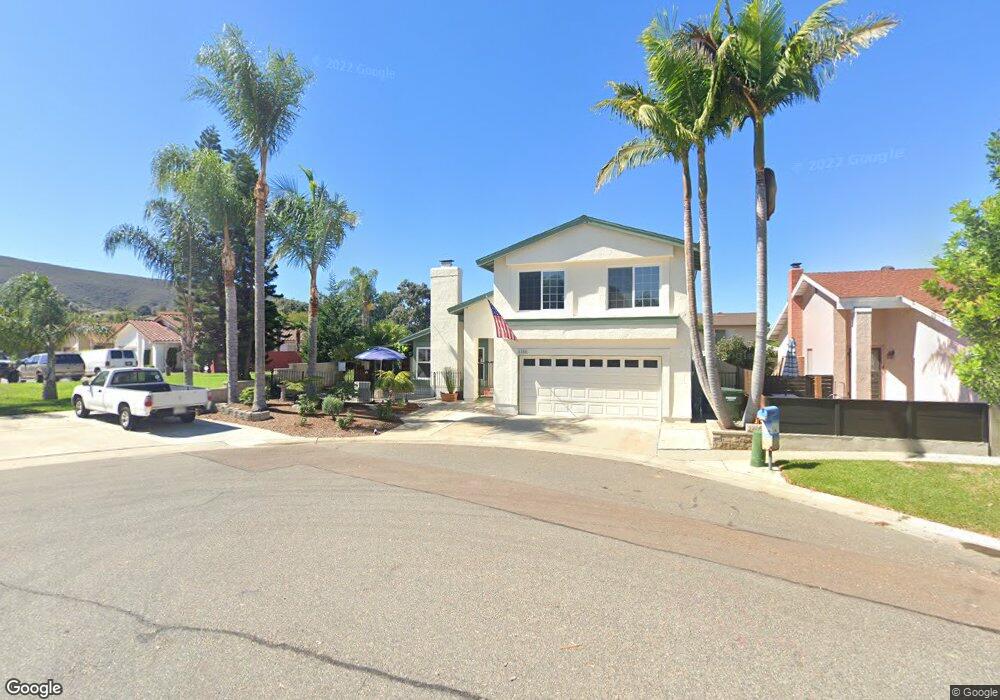
1020 Sparrow Ct San Marcos, CA 92078
Barham Discovery Community NeighborhoodEstimated Value: $1,029,000 - $1,091,000
4
Beds
2
Baths
1,794
Sq Ft
$588/Sq Ft
Est. Value
About This Home
This home is located at 1020 Sparrow Ct, San Marcos, CA 92078 and is currently estimated at $1,054,171, approximately $587 per square foot. 1020 Sparrow Ct is a home located in San Diego County with nearby schools including Discovery Elementary School, San Elijo Middle School, and San Marcos High School.
Ownership History
Date
Name
Owned For
Owner Type
Purchase Details
Closed on
Oct 12, 2020
Sold by
Kelley Anne K
Bought by
Kelley Anne K and The Kelley Family Trust
Current Estimated Value
Home Financials for this Owner
Home Financials are based on the most recent Mortgage that was taken out on this home.
Original Mortgage
$461,000
Outstanding Balance
$409,287
Interest Rate
2.8%
Mortgage Type
New Conventional
Estimated Equity
$644,884
Purchase Details
Closed on
Nov 13, 2019
Sold by
Kelley Anne K and Kelley Family Trust
Bought by
Kelley Anne K
Home Financials for this Owner
Home Financials are based on the most recent Mortgage that was taken out on this home.
Original Mortgage
$446,500
Interest Rate
3.65%
Mortgage Type
New Conventional
Purchase Details
Closed on
Sep 22, 2007
Sold by
Kelley Michael K and Kelley Anne K
Bought by
Kelley Michael K and Kelley Anne K
Purchase Details
Closed on
Nov 21, 2006
Sold by
Kelley Anne K
Bought by
Kelley Michael K and Kelley Anne K
Home Financials for this Owner
Home Financials are based on the most recent Mortgage that was taken out on this home.
Original Mortgage
$54,000
Interest Rate
6.09%
Mortgage Type
Stand Alone Second
Purchase Details
Closed on
Oct 1, 2004
Sold by
Kelley Michael K and Kelley Anne K
Bought by
Kelley Anne K
Purchase Details
Closed on
Oct 23, 2003
Sold by
Kelley Michael K and Kelley Anne K
Bought by
Kelley Michael K and Kelley Anne K
Home Financials for this Owner
Home Financials are based on the most recent Mortgage that was taken out on this home.
Original Mortgage
$308,000
Interest Rate
1.95%
Mortgage Type
Purchase Money Mortgage
Purchase Details
Closed on
Apr 26, 2003
Sold by
Kelley Michael Kevin and Kelley Anne Kristen
Bought by
Kelley Michael K and Kelley Anne K
Purchase Details
Closed on
Jul 12, 1998
Sold by
Kelley Michael and Kelley Anne R
Bought by
Kelley Michael Kevin and Kelley Anne Kristen
Home Financials for this Owner
Home Financials are based on the most recent Mortgage that was taken out on this home.
Original Mortgage
$40,000
Interest Rate
7.01%
Purchase Details
Closed on
Oct 27, 1997
Sold by
Laso Enrique R and Laso Harriet
Bought by
Kelley Michael and Kelley Anne R
Home Financials for this Owner
Home Financials are based on the most recent Mortgage that was taken out on this home.
Original Mortgage
$170,900
Interest Rate
7.05%
Purchase Details
Closed on
Aug 11, 1987
Purchase Details
Closed on
Jul 25, 1984
Create a Home Valuation Report for This Property
The Home Valuation Report is an in-depth analysis detailing your home's value as well as a comparison with similar homes in the area
Home Values in the Area
Average Home Value in this Area
Purchase History
| Date | Buyer | Sale Price | Title Company |
|---|---|---|---|
| Kelley Anne K | -- | Chicago Title Company | |
| Kelley Anne K | -- | Chicago Title Company | |
| Kelley Michael K | -- | None Available | |
| Kelley Michael K | -- | New Century Title Company | |
| Kelley Anne K | -- | -- | |
| Kelley Michael K | -- | Chicago Title Co | |
| Kelley Michael K | -- | Chicago Title Co | |
| Kelley Michael K | -- | -- | |
| Kelley Michael Kevin | -- | Southland Title Corporation | |
| Kelley Michael | $180,000 | Southland Title | |
| -- | $136,000 | -- | |
| -- | $113,000 | -- |
Source: Public Records
Mortgage History
| Date | Status | Borrower | Loan Amount |
|---|---|---|---|
| Open | Kelley Anne K | $461,000 | |
| Closed | Kelley Anne K | $446,500 | |
| Closed | Kelley Michael K | $54,000 | |
| Closed | Kelley Michael K | $432,000 | |
| Closed | Kelley Michael K | $308,000 | |
| Closed | Kelley Michael Kevin | $40,000 | |
| Previous Owner | Kelley Michael | $170,900 |
Source: Public Records
Tax History Compared to Growth
Tax History
| Year | Tax Paid | Tax Assessment Tax Assessment Total Assessment is a certain percentage of the fair market value that is determined by local assessors to be the total taxable value of land and additions on the property. | Land | Improvement |
|---|---|---|---|---|
| 2025 | $3,066 | $287,228 | $95,790 | $191,438 |
| 2024 | $3,066 | $281,597 | $93,912 | $187,685 |
| 2023 | $3,007 | $276,076 | $92,071 | $184,005 |
| 2022 | $2,965 | $270,664 | $90,266 | $180,398 |
| 2021 | $2,915 | $265,358 | $88,497 | $176,861 |
| 2020 | $2,886 | $262,638 | $87,590 | $175,048 |
| 2019 | $2,853 | $257,489 | $85,873 | $171,616 |
| 2018 | $2,761 | $252,441 | $84,190 | $168,251 |
| 2017 | $2,705 | $247,492 | $82,540 | $164,952 |
| 2016 | $2,662 | $242,640 | $80,922 | $161,718 |
| 2015 | $2,622 | $238,996 | $79,707 | $159,289 |
| 2014 | $2,561 | $234,315 | $78,146 | $156,169 |
Source: Public Records
Map
Nearby Homes
- 1261 Granada Way
- 1054 La Sombra Dr
- 1051 La Reina Dr
- 984 San Pablo Dr
- 1267 Discovery St
- 1286 Discovery St Unit 92
- 1286 Discovery St Unit SPC 16
- 1286 Discovery St Unit 47
- 1286 Discovery St Unit 61
- 1286 Discovery St Unit 148
- 1916 Fairway Circle Dr
- 1940 Fairway Circle Dr
- 1050 San Pablo Dr
- 1235 W San Marcos Blvd Unit 4
- 1027 Cima Dr
- 1176 La Sombra Dr
- 880 W San Marcos Blvd
- 1329 San Pablo Ct
- 1310 Miracielo Ct
- 1911 La Subida Way
- 1018 Sparrow Ct
- 1011 Wren Way
- 1009 Wren Way
- 1012 Sparrow Ct
- 1038 Pheasant Ct
- 1029 Sparrow Ct
- 1021 Sparrow Ct
- 1005 Wren Way
- 1238 Sunrise View Unit 103
- 1238 Sunrise View Unit 102
- 1238 Sunrise View Unit 105
- 1238 Sunrise View Unit 104
- 1008 Sparrow Ct
- 1044 Pheasant Ct
- 1037 Pheasant Ct
- 1015 Sparrow Ct
- 1043 Pheasant Ct
- 1001 Wren Way
- 1009 Sparrow Ct Unit 4
- 1028 Mockingbird Ln