Estimated Value: $480,000 - $509,327
4
Beds
3
Baths
1,806
Sq Ft
$277/Sq Ft
Est. Value
About This Home
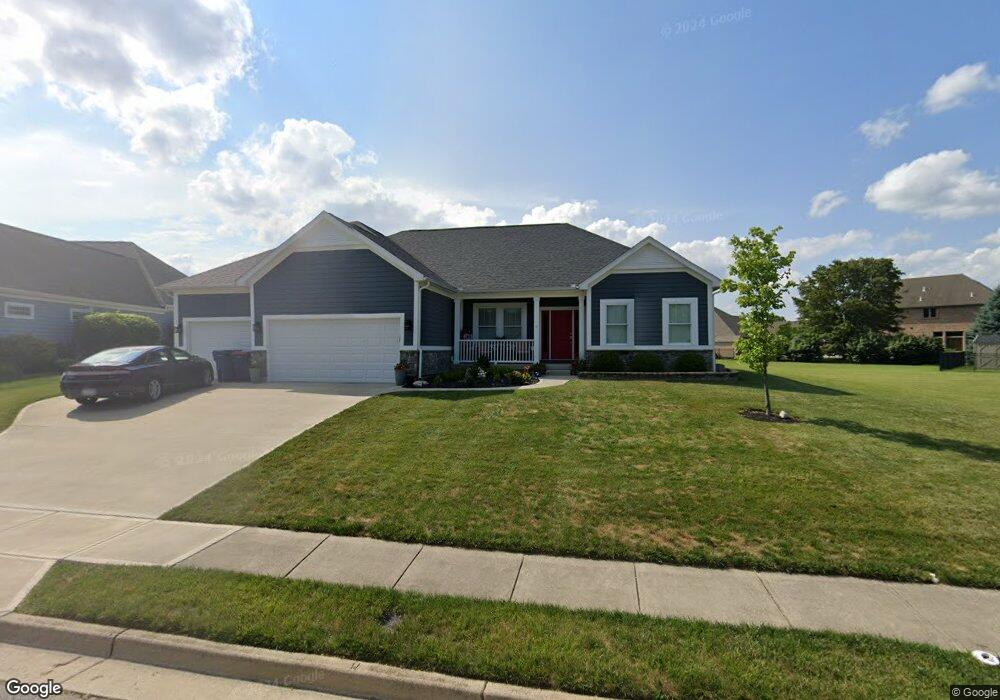
This home is located at 1020 Westview Dr Unit 8300, Piqua, OH 45356 and is currently estimated at $500,082, approximately $276 per square foot. 1020 Westview Dr Unit 8300 is a home located in Miami County with nearby schools including Washington Primary School, Piqua Junior High School, and Piqua High School.
Ownership History
Date
Name
Owned For
Owner Type
Purchase Details
Closed on
Dec 27, 2024
Sold by
Webb David J
Bought by
Myers John Robert and Myers Robin Francis
Current Estimated Value
Home Financials for this Owner
Home Financials are based on the most recent Mortgage that was taken out on this home.
Original Mortgage
$100,000
Outstanding Balance
$97,205
Interest Rate
6.02%
Mortgage Type
New Conventional
Estimated Equity
$402,877
Purchase Details
Closed on
Apr 30, 2021
Sold by
Ziegler Webb Sandy
Bought by
Webb David J
Purchase Details
Closed on
Jun 5, 2017
Sold by
Alexander Clifford R Trustee
Bought by
Sandy Ziegler-Webb and David J Webb
Home Financials for this Owner
Home Financials are based on the most recent Mortgage that was taken out on this home.
Interest Rate
3.94%
Purchase Details
Closed on
Feb 17, 2009
Sold by
Piqua Development Twenty Inc
Bought by
Alexander Clifford R
Create a Home Valuation Report for This Property
The Home Valuation Report is an in-depth analysis detailing your home's value as well as a comparison with similar homes in the area
Home Values in the Area
Average Home Value in this Area
Purchase History
| Date | Buyer | Sale Price | Title Company |
|---|---|---|---|
| Myers John Robert | $479,000 | None Listed On Document | |
| Webb David J | -- | None Available | |
| Sandy Ziegler-Webb | $32,000 | -- | |
| Alexander Clifford R | $125,000 | -- |
Source: Public Records
Mortgage History
| Date | Status | Borrower | Loan Amount |
|---|---|---|---|
| Open | Myers John Robert | $100,000 | |
| Previous Owner | Alexander Clifford R | -- |
Source: Public Records
Tax History Compared to Growth
Tax History
| Year | Tax Paid | Tax Assessment Tax Assessment Total Assessment is a certain percentage of the fair market value that is determined by local assessors to be the total taxable value of land and additions on the property. | Land | Improvement |
|---|---|---|---|---|
| 2024 | $5,425 | $131,920 | $20,650 | $111,270 |
| 2023 | $5,425 | $131,920 | $20,650 | $111,270 |
| 2022 | $5,520 | $131,920 | $20,650 | $111,270 |
| 2021 | $4,569 | $97,730 | $15,300 | $82,430 |
| 2020 | $4,492 | $97,730 | $15,300 | $82,430 |
| 2019 | $4,517 | $97,730 | $15,300 | $82,430 |
| 2018 | $701 | $14,460 | $14,460 | $0 |
| 2017 | $569 | $11,590 | $11,590 | $0 |
| 2016 | $563 | $11,590 | $11,590 | $0 |
| 2015 | $576 | $11,590 | $11,590 | $0 |
| 2014 | $576 | $11,590 | $11,590 | $0 |
| 2013 | $578 | $11,590 | $11,590 | $0 |
Source: Public Records
Map
Nearby Homes
- 513 Spotted Doe Trail
- 8490 Bennett Dr
- 1821 Wilshire Dr
- 1337 Stratford Dr
- 1708 Dubois Dr
- 3 Lake Ridge Dr
- 4510 W State Route 185
- 4528 W State Route 185
- 1616 Echo Lake Dr
- 1207 Maplewood Dr
- 1271 Park Ave
- 1119 Anderson St
- 215 Levering Dr
- 817 Washington Ave
- 1435 Covington Ave
- 1115 Madison Ave
- 1200 W High St
- 1016 Westview Dr
- 1024 Westview Dr
- 2201 Eagles Lake Dr
- 2109 Eagles Lake Dr
- 2205 Eagles Lake Dr
- 1012 Westview Dr
- 2101 Eagles Lake Dr
- 1015 Westview Dr
- 1019 Westview Dr
- 1023 Westview Dr
- 1009 Westview Dr
- 1008 Westview Dr Unit 8297
- 1030 Westview Dr
- 2200 Eagles Lake Dr
- 1031 Westview Dr
- 2204 Eagles Lake Dr
- 10 Coronada Ct
- 2104 Eagles Lake Dr
- 1004 Westview Dr
- 1003 Westview Dr