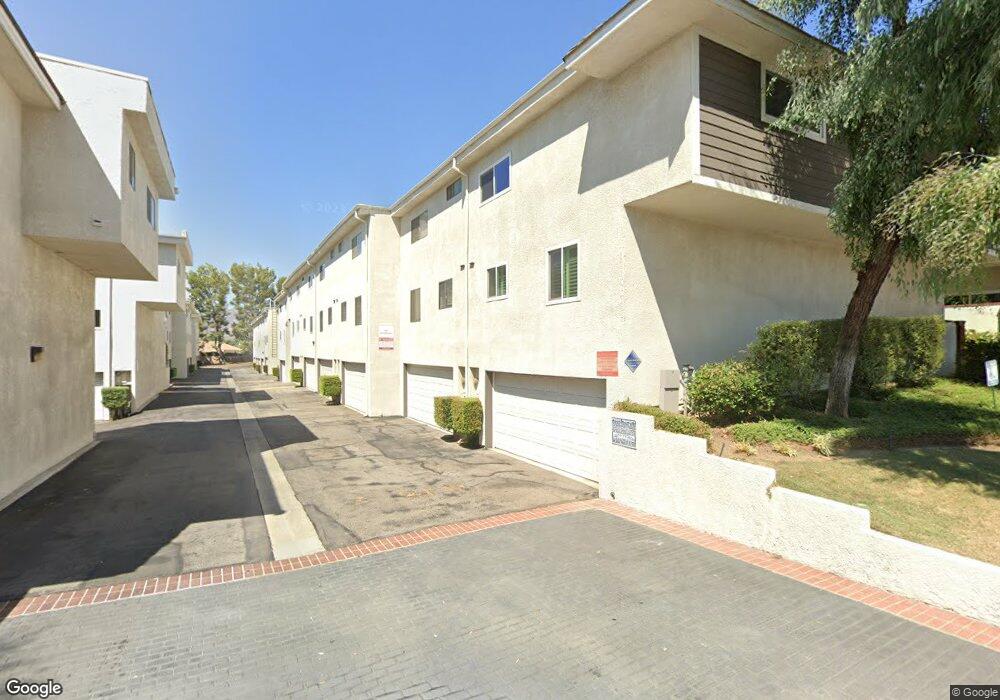
10201 Mason Ave Unit 94 Chatsworth, CA 91311
Estimated Value: $621,521 - $736,000
2
Beds
3
Baths
1,520
Sq Ft
$430/Sq Ft
Est. Value
About This Home
This home is located at 10201 Mason Ave Unit 94, Chatsworth, CA 91311 and is currently estimated at $653,380, approximately $429 per square foot. 10201 Mason Ave Unit 94 is a home located in Los Angeles County with nearby schools including Ernest Lawrence Middle School, Superior Street Elementary School, and Our Community School.
Ownership History
Date
Name
Owned For
Owner Type
Purchase Details
Closed on
Sep 21, 2018
Sold by
Mackey William Edward
Bought by
Mackey William Edward and Mackey Sandy Lea
Current Estimated Value
Home Financials for this Owner
Home Financials are based on the most recent Mortgage that was taken out on this home.
Original Mortgage
$622,500
Outstanding Balance
$616,523
Interest Rate
5%
Mortgage Type
Reverse Mortgage Home Equity Conversion Mortgage
Estimated Equity
$36,858
Purchase Details
Closed on
Apr 14, 2006
Sold by
Mackey William
Bought by
Mackey William Edward and Mackey Sandy Lea
Purchase Details
Closed on
Apr 3, 2002
Sold by
Flanagan Timothy E
Bought by
Mackey William and Mackey Sandy
Purchase Details
Closed on
Nov 3, 1998
Sold by
Flanagan Timothy E
Bought by
Flanagan Timothy E and Flanagan Lisa M
Create a Home Valuation Report for This Property
The Home Valuation Report is an in-depth analysis detailing your home's value as well as a comparison with similar homes in the area
Home Values in the Area
Average Home Value in this Area
Purchase History
| Date | Buyer | Sale Price | Title Company |
|---|---|---|---|
| Mackey William Edward | -- | North American Title Company | |
| Mackey William Edward | -- | North American Title Company | |
| Mackey William Edward | -- | None Available | |
| Mackey William | $211,000 | First Southwestern Title Co | |
| Flanagan Timothy E | -- | -- |
Source: Public Records
Mortgage History
| Date | Status | Borrower | Loan Amount |
|---|---|---|---|
| Open | Mackey William Edward | $622,500 | |
| Closed | Mackey William Edward | $622,500 |
Source: Public Records
Tax History Compared to Growth
Tax History
| Year | Tax Paid | Tax Assessment Tax Assessment Total Assessment is a certain percentage of the fair market value that is determined by local assessors to be the total taxable value of land and additions on the property. | Land | Improvement |
|---|---|---|---|---|
| 2025 | $3,805 | $310,948 | $144,027 | $166,921 |
| 2024 | $3,805 | $304,852 | $141,203 | $163,649 |
| 2023 | $3,732 | $298,876 | $138,435 | $160,441 |
| 2022 | $3,559 | $293,017 | $135,721 | $157,296 |
| 2021 | $3,508 | $287,272 | $133,060 | $154,212 |
| 2019 | $3,402 | $278,753 | $129,114 | $149,639 |
| 2018 | $3,356 | $273,288 | $126,583 | $146,705 |
| 2017 | $3,280 | $267,930 | $124,101 | $143,829 |
| 2016 | $3,192 | $262,677 | $121,668 | $141,009 |
| 2015 | $3,145 | $258,732 | $119,841 | $138,891 |
| 2014 | $3,160 | $253,665 | $117,494 | $136,171 |
Source: Public Records
Map
Nearby Homes
- 10201 Mason Ave Unit 34
- 10042 Sunnybrae Ave
- 10122 Jovita Ave
- 20722 Devonshire St
- 20718 Devonshire St Unit C
- 20236 Foix Place
- 20656 Septo St
- 10220 De Soto Ave Unit 24
- 20306 Tau Place
- 20244 Septo St
- 20500 Blairmoore St
- 20115 Romar St
- 0 De Soto Unit OC25120663
- 20158 Septo St
- 20323 Kinzie St
- 10155 De Soto Ave Unit 104
- 10159 De Soto Ave Unit 202
- 20652 Lassen St Unit 125 1/2
- 10125 De Soto Ave Unit 43
- 10501 Oklahoma Ave
- 10201 Mason Ave
- 10201 Mason Ave Unit 13
- 10201 Mason Ave
- 10201 Mason Ave Unit 18
- 10201 Mason Ave Unit 97
- 10201 Mason Ave Unit 96
- 10201 Mason Ave Unit 95
- 10201 Mason Ave Unit 93
- 10201 Mason Ave Unit 92
- 10201 Mason Ave Unit 91
- 10201 Mason Ave Unit 90
- 10201 Mason Ave Unit 89
- 10201 Mason Ave Unit 88
- 10201 Mason Ave Unit 87
- 10201 Mason Ave Unit 86
- 10201 Mason Ave Unit 85
- 10201 Mason Ave Unit 84
- 10201 Mason Ave Unit 83
- 10201 Mason Ave Unit 82
- 10201 Mason Ave Unit 33