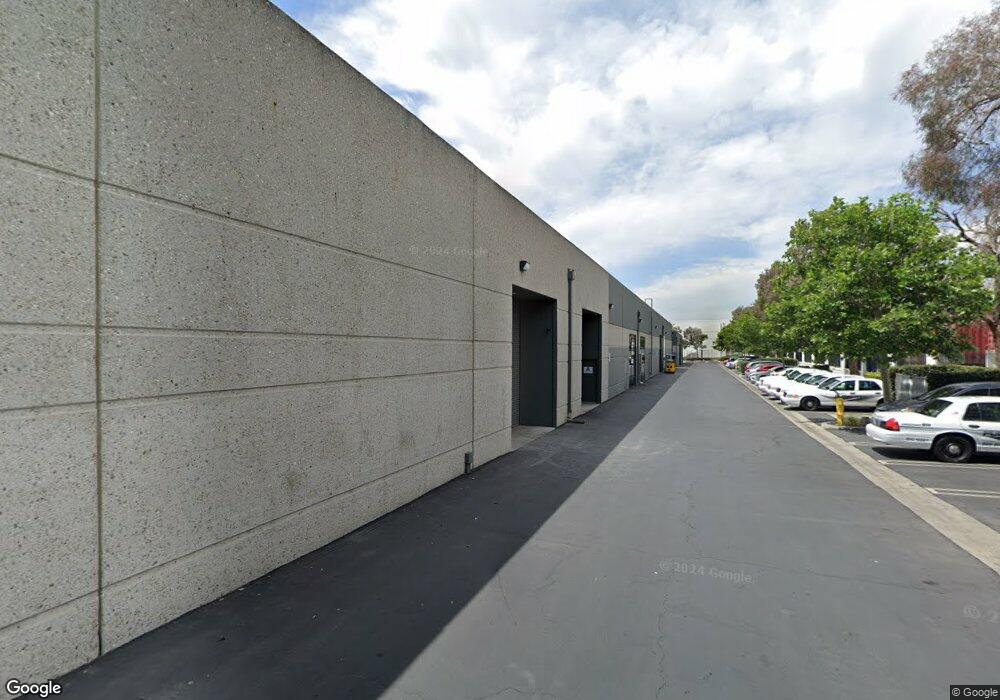
10201 Trademark St Unit D Rancho Cucamonga, CA 91730
Estimated Value: $2,261,011
--
Bed
--
Bath
5,664
Sq Ft
$399/Sq Ft
Est. Value
About This Home
This home is located at 10201 Trademark St Unit D, Rancho Cucamonga, CA 91730 and is currently estimated at $2,261,011, approximately $399 per square foot. 10201 Trademark St Unit D is a home located in San Bernardino County with nearby schools including Ontario Center School, Rancho Cucamonga Middle, and Colony High.
Ownership History
Date
Name
Owned For
Owner Type
Purchase Details
Closed on
Jun 28, 2023
Sold by
Skyroad Llc
Bought by
Moon Home Llc
Current Estimated Value
Purchase Details
Closed on
May 5, 2021
Sold by
Four Leaf Investment Group Llc
Bought by
Skyroad Llc
Home Financials for this Owner
Home Financials are based on the most recent Mortgage that was taken out on this home.
Original Mortgage
$4,000
Interest Rate
2.9%
Mortgage Type
Small Business Administration
Purchase Details
Closed on
Apr 18, 1997
Sold by
Dolan Robert
Bought by
Four Leaf Investment Group Llc
Purchase Details
Closed on
Feb 13, 1997
Sold by
Employees Retirement Plan Of Consolidate
Bought by
Dolan Robert and Dolan Cheryl
Home Financials for this Owner
Home Financials are based on the most recent Mortgage that was taken out on this home.
Original Mortgage
$408,473
Interest Rate
7.86%
Mortgage Type
Commercial
Purchase Details
Closed on
Oct 9, 1995
Sold by
Whc One Investors Lp
Bought by
Employees Retirement Plan Of Consolidate
Purchase Details
Closed on
Aug 18, 1994
Sold by
Burke Trademark Partners
Bought by
Whc One Investors Lp
Create a Home Valuation Report for This Property
The Home Valuation Report is an in-depth analysis detailing your home's value as well as a comparison with similar homes in the area
Home Values in the Area
Average Home Value in this Area
Purchase History
| Date | Buyer | Sale Price | Title Company |
|---|---|---|---|
| Moon Home Llc | $2,100,000 | Stewart Title | |
| Skyroad Llc | $1,462,500 | Lawyers Title | |
| Four Leaf Investment Group Llc | -- | Chicago Title | |
| Dolan Robert | $304,000 | Chicago Title Co | |
| Employees Retirement Plan Of Consolidate | $4,225,000 | Chicago Title Co | |
| Whc One Investors Lp | $2,841,750 | Commonwealth Land Title Co |
Source: Public Records
Mortgage History
| Date | Status | Borrower | Loan Amount |
|---|---|---|---|
| Previous Owner | Skyroad Llc | $4,000 | |
| Previous Owner | Dolan Robert | $408,473 |
Source: Public Records
Tax History Compared to Growth
Tax History
| Year | Tax Paid | Tax Assessment Tax Assessment Total Assessment is a certain percentage of the fair market value that is determined by local assessors to be the total taxable value of land and additions on the property. | Land | Improvement |
|---|---|---|---|---|
| 2025 | $22,658 | $2,142,000 | $510,000 | $1,632,000 |
| 2024 | $22,658 | $2,100,000 | $500,000 | $1,600,000 |
| 2023 | $16,494 | $1,521,231 | $208,080 | $1,313,151 |
| 2022 | $16,173 | $1,491,403 | $204,000 | $1,287,403 |
| 2021 | $5,405 | $457,408 | $25,577 | $431,831 |
| 2020 | $5,317 | $452,718 | $25,315 | $427,403 |
| 2019 | $5,304 | $443,842 | $24,819 | $419,023 |
| 2018 | $5,184 | $435,139 | $24,332 | $410,807 |
| 2017 | $5,013 | $426,607 | $23,855 | $402,752 |
| 2016 | $4,955 | $418,242 | $23,387 | $394,855 |
| 2015 | $4,934 | $411,960 | $23,036 | $388,924 |
| 2014 | $4,765 | $403,891 | $22,585 | $381,306 |
Source: Public Records
Map
Nearby Homes
- 948 N Turner Ave
- Plan 1 at Metro at Piemonte
- Plan 2 at Metro at Piemonte
- Plan 3 at Metro at Piemonte
- 3542 E Indigo Privado
- 3075 E Via Rosso
- 9412 Archibald Ave
- 2916 E Via Fiano
- 2908 E Via Fiano
- 9593 Brook Dr
- 721 Via Dolcetto
- 9523 Sunglow Ct
- 10108 24th St
- 10215 25th St
- 11042 Luminate Dr
- 11053 Momentum Dr
- 11055 Wander Dr
- 11063 Wander Dr
- 944 N Divino Privado
- 11012 Serenity Dr
- 10261 Trademark St
- 10251 Trademark St
- 10251 Trademark St Unit B
- 10251 Trademark St Unit A
- 10241 Trademark St
- 10241 Trademark St Unit A
- 10281 Trademark St
- 10241 Trademark Unit "B" St
- 9620 Center Ave Unit 130
- 10220 4th St
- 10370 Commerce Center Dr Unit B-230
- 10370 Commerce Center Dr Unit B-140
- 10370 Commerce Center Dr Unit B210
- 10370 Commerce Center Dr Unit A-200
- 10370 Commerce Center Dr Unit B-100
- 10370 Commerce Center Dr
- Lot 21 Pr 8641
- 10350 Commerce Center Dr Unit A-150
- 10350 Commerce Center Dr Unit B-220
- 10350 Commerce Center Dr Unit B-115