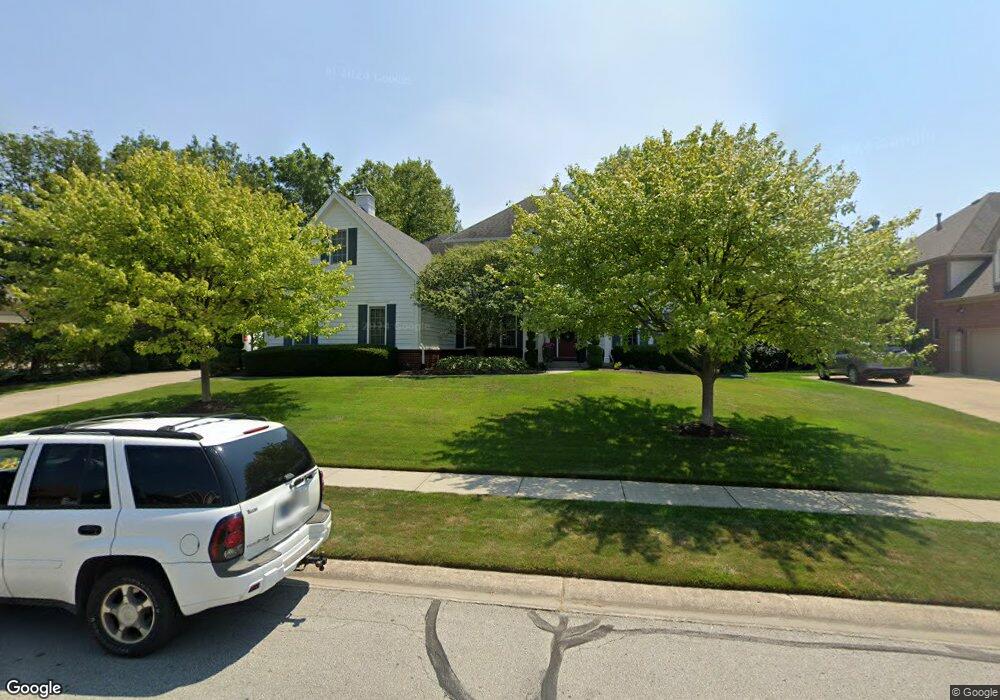
10204 Water Crest Dr Fishers, IN 46038
Estimated Value: $618,708 - $671,000
4
Beds
3
Baths
3,896
Sq Ft
$166/Sq Ft
Est. Value
About This Home
This home is located at 10204 Water Crest Dr, Fishers, IN 46038 and is currently estimated at $647,427, approximately $166 per square foot. 10204 Water Crest Dr is a home located in Hamilton County with nearby schools including Cumberland Road Elementary School, East Middle School, and Fishers Junior High School.
Ownership History
Date
Name
Owned For
Owner Type
Purchase Details
Closed on
Dec 18, 2019
Sold by
Halkovich Leslie
Bought by
The Leslie Halkovich Living Trust
Current Estimated Value
Purchase Details
Closed on
Apr 11, 2018
Sold by
Cornell Leslie and Cornell Lended
Bought by
Hallovich Leslie
Purchase Details
Closed on
Aug 2, 2016
Sold by
Cornell George J
Bought by
Cornell Leslic D
Purchase Details
Closed on
May 15, 2001
Sold by
Regal Homes Inc
Bought by
Cornell George J and Cornell Leslie D
Home Financials for this Owner
Home Financials are based on the most recent Mortgage that was taken out on this home.
Original Mortgage
$237,200
Interest Rate
7.02%
Mortgage Type
Purchase Money Mortgage
Create a Home Valuation Report for This Property
The Home Valuation Report is an in-depth analysis detailing your home's value as well as a comparison with similar homes in the area
Home Values in the Area
Average Home Value in this Area
Purchase History
| Date | Buyer | Sale Price | Title Company |
|---|---|---|---|
| The Leslie Halkovich Living Trust | -- | None Available | |
| Hallovich Leslie | -- | None Available | |
| Cornell Leslic D | -- | None Available | |
| Cornell George J | -- | -- |
Source: Public Records
Mortgage History
| Date | Status | Borrower | Loan Amount |
|---|---|---|---|
| Previous Owner | Cornell George J | $237,200 | |
| Closed | Cornell George J | $37,800 |
Source: Public Records
Tax History Compared to Growth
Tax History
| Year | Tax Paid | Tax Assessment Tax Assessment Total Assessment is a certain percentage of the fair market value that is determined by local assessors to be the total taxable value of land and additions on the property. | Land | Improvement |
|---|---|---|---|---|
| 2024 | $5,773 | $514,000 | $86,600 | $427,400 |
| 2023 | $5,808 | $498,700 | $86,600 | $412,100 |
| 2022 | $5,216 | $437,200 | $86,600 | $350,600 |
| 2021 | $4,548 | $378,900 | $86,600 | $292,300 |
| 2020 | $4,427 | $367,700 | $86,600 | $281,100 |
| 2019 | $4,379 | $363,800 | $75,800 | $288,000 |
| 2018 | $4,434 | $367,300 | $75,800 | $291,500 |
| 2017 | $3,891 | $328,800 | $75,800 | $253,000 |
| 2016 | $3,805 | $321,900 | $75,800 | $246,100 |
| 2014 | $3,243 | $299,200 | $75,800 | $223,400 |
| 2013 | $3,243 | $301,700 | $75,800 | $225,900 |
Source: Public Records
Map
Nearby Homes
- 10093 Parkshore Dr
- 10175 Pamona Ct
- 10523 Hollowood Ct
- 13763 Meadow Lake Dr
- 10055 Plantana Blvd
- 9887 Cranberry Cir
- 14041 Mimosa Ct
- 10150 Beresford Ct
- 13853 Oak Grove Ct
- 10343 Waveland Cir
- 10414 Bicknell Cir
- 10270 Apple Blossom Cir
- 13068 Lamarque Place
- 11798 & 11842 E 131st St
- 13854 Meadow Grass Way
- 10190 Holly Berry Cir
- 9984 Gentry Dr
- 13048 Ross Crossing
- 14243 Holly Berry Cir
- 9989 Worthington Blvd
- 13460 Water Crest Dr
- 13613 Water Crest Dr
- 13461 Water Crest Dr
- 13400 Water Crest Dr
- 10184 Water Crest Dr
- 10224 Water Crest Dr
- 13596 Marlowe Ct
- 10217 Water Crest Dr
- 10164 Water Crest Dr
- 10197 Water Crest Dr
- 10244 Water Crest Dr
- 13597 Marlowe Ct
- 13596 Sweet Briar Pkwy
- 13594 Marlowe Ct
- 10237 Water Crest Dr
- 10177 Water Crest Dr
- 13598 Sweet Briar Pkwy
- 13593 Marlowe Ct
- 10264 Water Crest Dr
- 10144 Water Crest Dr Unit 580087