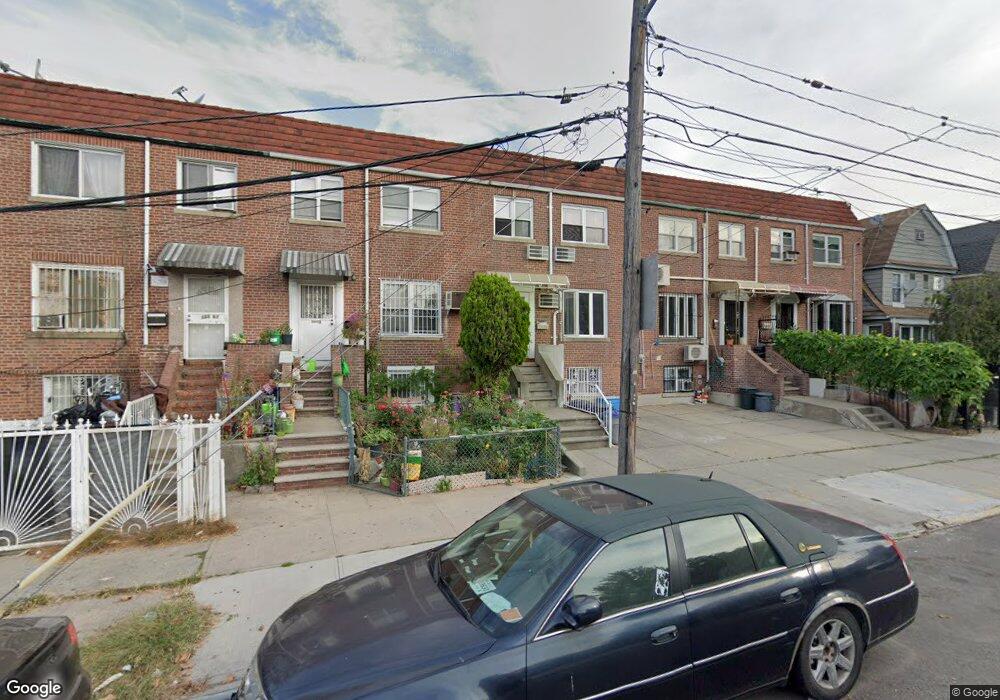
10205 47th Ave Corona, NY 11368
Corona NeighborhoodEstimated Value: $903,836 - $1,164,000
--
Bed
--
Bath
1,672
Sq Ft
$604/Sq Ft
Est. Value
About This Home
This home is located at 10205 47th Ave, Corona, NY 11368 and is currently estimated at $1,009,709, approximately $603 per square foot. 10205 47th Ave is a home located in Queens County with nearby schools including P.S. 16 the Nancy Debenedittis School, Is 61 Leonardo Da Vinci, and John Bowne High School.
Ownership History
Date
Name
Owned For
Owner Type
Purchase Details
Closed on
Feb 6, 2017
Sold by
Qu Xiao Zhong and Qu Xing Quan
Bought by
Qu Xiao Zhong
Current Estimated Value
Purchase Details
Closed on
Oct 19, 2010
Sold by
Kaur Baljit and Singh Paramjit
Bought by
Qu Xiao Zhong and Qu Xing Quan
Home Financials for this Owner
Home Financials are based on the most recent Mortgage that was taken out on this home.
Original Mortgage
$150,000
Interest Rate
4.41%
Purchase Details
Closed on
Nov 20, 2006
Sold by
Galea Girolamo
Bought by
Kaur Baljit and Singh Paramjit
Home Financials for this Owner
Home Financials are based on the most recent Mortgage that was taken out on this home.
Original Mortgage
$50,500
Interest Rate
6.36%
Purchase Details
Closed on
Jun 15, 2006
Sold by
Galea Girolamo and Nicastro Lucia
Bought by
Galea Girolamo
Create a Home Valuation Report for This Property
The Home Valuation Report is an in-depth analysis detailing your home's value as well as a comparison with similar homes in the area
Home Values in the Area
Average Home Value in this Area
Purchase History
| Date | Buyer | Sale Price | Title Company |
|---|---|---|---|
| Qu Xiao Zhong | -- | -- | |
| Qu Xiao Zhong | -- | -- | |
| Qu Xiao Zhong | $530,000 | -- | |
| Qu Xiao Zhong | $530,000 | -- | |
| Kaur Baljit | $530,000 | -- | |
| Kaur Baljit | $530,000 | -- | |
| Galea Girolamo | -- | -- | |
| Galea Girolamo | -- | -- |
Source: Public Records
Mortgage History
| Date | Status | Borrower | Loan Amount |
|---|---|---|---|
| Previous Owner | Qu Xiao Zhong | $150,000 | |
| Previous Owner | Kaur Baljit | $50,500 | |
| Previous Owner | Kaur Baljit | $400,000 |
Source: Public Records
Tax History Compared to Growth
Tax History
| Year | Tax Paid | Tax Assessment Tax Assessment Total Assessment is a certain percentage of the fair market value that is determined by local assessors to be the total taxable value of land and additions on the property. | Land | Improvement |
|---|---|---|---|---|
| 2025 | $7,636 | $40,300 | $7,750 | $32,550 |
| 2024 | $7,636 | $38,020 | $7,633 | $30,387 |
| 2023 | $7,204 | $35,868 | $6,635 | $29,233 |
| 2022 | $6,755 | $45,240 | $9,600 | $35,640 |
| 2021 | $7,122 | $45,180 | $9,600 | $35,580 |
| 2020 | $7,109 | $43,440 | $9,600 | $33,840 |
| 2019 | $6,628 | $40,620 | $9,600 | $31,020 |
| 2018 | $6,093 | $29,890 | $9,304 | $20,586 |
| 2017 | $5,749 | $28,200 | $8,028 | $20,172 |
| 2016 | $5,637 | $28,200 | $8,028 | $20,172 |
| 2015 | $3,209 | $27,986 | $9,417 | $18,569 |
| 2014 | $3,209 | $26,403 | $9,611 | $16,792 |
Source: Public Records
Map
Nearby Homes
- 102-14 Corona Ave
- 102-29 Nicolls Ave Unit 2A
- 10140 Nicolls Ave
- 47-19 99th St
- 102-48 Nicolls Ave
- 10205 46th Ave
- 101-17 46th Ave
- 10121 46th Ave
- 99-32 Alstyne Ave
- 102-62 Nicolls Ave
- 45-04 102nd St
- 102-56 46th Ave
- 4902 99th St
- 104-20 47th Ave
- 98-22 Alstyne Ave
- 45-09 104th St
- 104-47 49th Ave
- 98-02 Corona Ave
- 103-26 Alstyne Ave
- 43-12 104th St
- 10203 47th Ave
- 10207 47th Ave
- 10201 47th Ave
- 10209 47th Ave
- 10211 47th Ave
- 4609 102nd St
- 102-15 47th Ave
- 10215 47th Ave
- 4607 102nd St
- 4605 102nd St
- 160 47th Ave
- 0 47th Ave
- 0 47th Ave Unit 3D
- 10217 47th Ave
- 10212 46th Ave
- 4601 102nd St Unit 1 Fl
- 10214 46th Ave
- 4601 102nd St
- 4620 102nd St
- 4612 102nd St