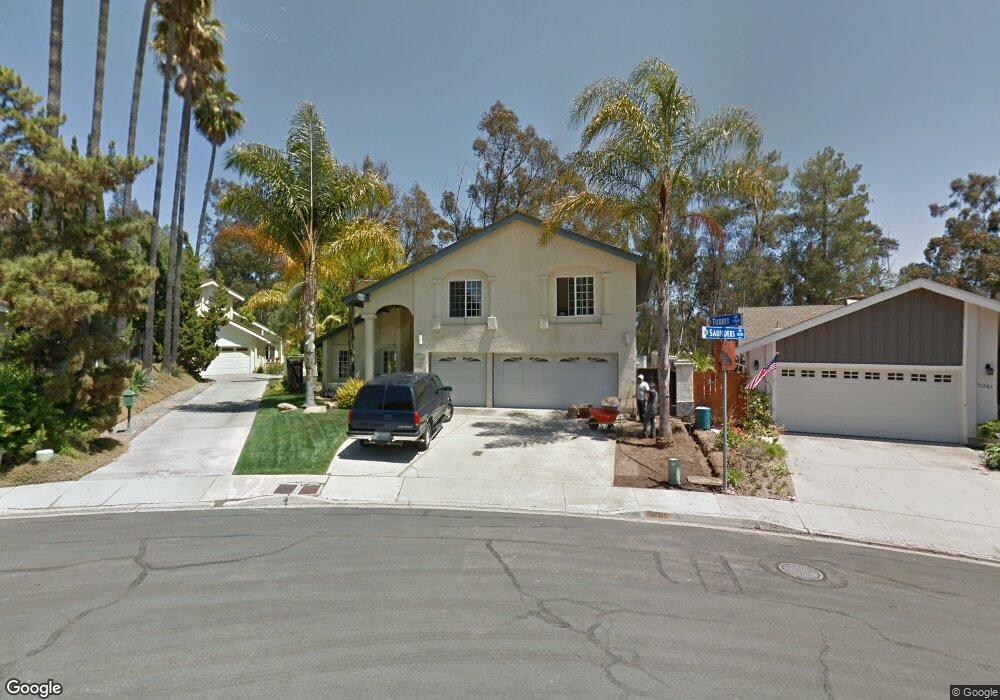
10205 Saunders Dr San Diego, CA 92131
Scripps Ranch NeighborhoodEstimated Value: $1,709,195 - $1,819,000
4
Beds
3
Baths
2,802
Sq Ft
$623/Sq Ft
Est. Value
About This Home
This home is located at 10205 Saunders Dr, San Diego, CA 92131 and is currently estimated at $1,745,049, approximately $622 per square foot. 10205 Saunders Dr is a home located in San Diego County with nearby schools including Miramar Ranch Elementary School, Thurgood Marshall Middle School, and Scripps Ranch High School.
Ownership History
Date
Name
Owned For
Owner Type
Purchase Details
Closed on
Feb 18, 2014
Sold by
Lindsey Diane R
Bought by
Lindsey Diane R
Current Estimated Value
Purchase Details
Closed on
Feb 27, 2007
Sold by
Lindsey Diane R and Slover Diane R
Bought by
Lindsey Diane R
Purchase Details
Closed on
May 20, 2003
Sold by
Slover Steven P
Bought by
Slover Diane R
Home Financials for this Owner
Home Financials are based on the most recent Mortgage that was taken out on this home.
Original Mortgage
$322,700
Outstanding Balance
$134,826
Interest Rate
5.26%
Mortgage Type
Stand Alone First
Estimated Equity
$1,610,223
Purchase Details
Closed on
Jul 6, 1994
Sold by
Rake Don D and Rake Beulah M
Bought by
Slover Steven P and Slover Diane R
Home Financials for this Owner
Home Financials are based on the most recent Mortgage that was taken out on this home.
Original Mortgage
$287,100
Interest Rate
6.75%
Purchase Details
Closed on
Jul 28, 1988
Create a Home Valuation Report for This Property
The Home Valuation Report is an in-depth analysis detailing your home's value as well as a comparison with similar homes in the area
Home Values in the Area
Average Home Value in this Area
Purchase History
| Date | Buyer | Sale Price | Title Company |
|---|---|---|---|
| Lindsey Diane R | -- | None Available | |
| Lindsey Diane R | -- | Chicago Title Co | |
| Slover Diane R | -- | Chicago Title Co | |
| Slover Steven P | $319,000 | South Coast Title Co | |
| -- | $279,900 | -- |
Source: Public Records
Mortgage History
| Date | Status | Borrower | Loan Amount |
|---|---|---|---|
| Open | Slover Diane R | $322,700 | |
| Closed | Slover Steven P | $287,100 |
Source: Public Records
Tax History Compared to Growth
Tax History
| Year | Tax Paid | Tax Assessment Tax Assessment Total Assessment is a certain percentage of the fair market value that is determined by local assessors to be the total taxable value of land and additions on the property. | Land | Improvement |
|---|---|---|---|---|
| 2025 | $6,746 | $544,491 | $129,114 | $415,377 |
| 2024 | $6,746 | $533,816 | $126,583 | $407,233 |
| 2023 | $6,588 | $523,350 | $124,101 | $399,249 |
| 2022 | $6,403 | $513,089 | $121,668 | $391,421 |
| 2021 | $6,347 | $503,030 | $119,283 | $383,747 |
| 2020 | $6,268 | $497,873 | $118,060 | $379,813 |
| 2019 | $6,155 | $488,112 | $115,746 | $372,366 |
| 2018 | $5,759 | $478,542 | $113,477 | $365,065 |
| 2017 | $80 | $469,159 | $111,252 | $357,907 |
| 2016 | $5,528 | $459,961 | $109,071 | $350,890 |
| 2015 | $5,444 | $453,053 | $107,433 | $345,620 |
| 2014 | $5,357 | $444,179 | $105,329 | $338,850 |
Source: Public Records
Map
Nearby Homes
- 9950 Dichondra Place
- 10265 Aviary Dr
- 10473 Crosscreek Terrace
- 10466 Ridgewater Ln
- 10831 Ironwood Rd
- 10535 Arbor Park Place
- 10415 Mesa Madera Dr
- 11646 La Colina Rd
- 10405 White Birch Dr
- 10594 Rookwood Dr
- 10545 Caminito Memosac
- 10616 Falcon Rim Point
- 10497 Caminito Mayten
- 10447 Caminito Banyon
- 10280 Caminito Rio Branco
- 10374 Caminito Banyon Unit U140
- 11787 La Colina Rd
- 10343 Caminito Aralia Unit 64
- 10333 Caminito Aralia Unit 70
- 9931 Caminito Tomatillo
- 11089 Turret Dr
- 10215 Saunders Dr
- 10235 Saunders Dr
- 11083 Turret Dr
- 11096 Turret Dr
- 11109 Saunders Ct
- 11115 Saunders Ct
- 11077 Turret Dr
- 11121 Saunders Ct
- 11090 Turret Dr
- 11135 Saunders Ct
- 10244 Saunders Dr
- 11129 Saunders Ct
- 11082 Turret Dr
- 10258 Saunders Dr
- 9978 Bourbon Ct
- 9990 Dichondra Place
- 9990 Bourbon Ct
- 11065 Turret Dr
- 11141 Saunders Ct