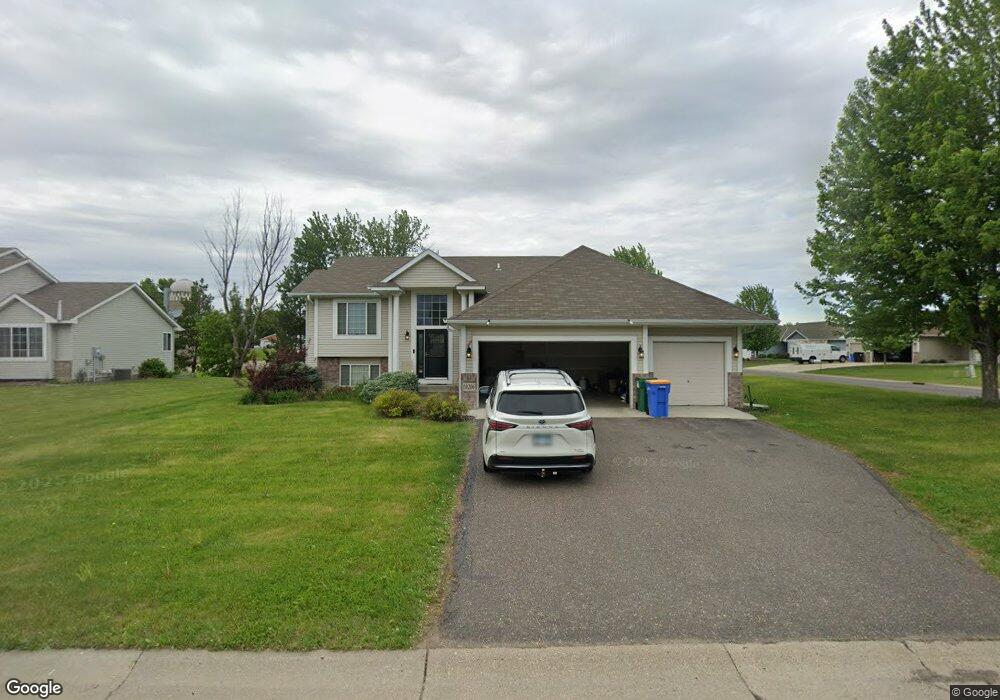
10206 31st St NE Saint Michael, MN 55376
Estimated Value: $400,633 - $428,000
4
Beds
3
Baths
2,522
Sq Ft
$165/Sq Ft
Est. Value
About This Home
This home is located at 10206 31st St NE, Saint Michael, MN 55376 and is currently estimated at $416,908, approximately $165 per square foot. 10206 31st St NE is a home located in Wright County with nearby schools including St. Michael Elementary School, Albertville Primary School, and Middle School East.
Ownership History
Date
Name
Owned For
Owner Type
Purchase Details
Closed on
Jun 4, 2020
Sold by
Hpa Us1 Llc
Bought by
Hpa Ii Borrower 2020 1 Llc
Current Estimated Value
Purchase Details
Closed on
Jan 2, 2020
Sold by
Jkg Properties Llc
Bought by
Hpa Us1 Llc
Purchase Details
Closed on
Jul 16, 2019
Sold by
Us Bank National Association
Bought by
Jkg Properties Llc
Home Financials for this Owner
Home Financials are based on the most recent Mortgage that was taken out on this home.
Original Mortgage
$210,400
Interest Rate
3.8%
Mortgage Type
Commercial
Purchase Details
Closed on
Apr 10, 2018
Sold by
Peterson Michael L
Bought by
Us Bank Na and Washington Mutual Mtg Pass Through Cert
Purchase Details
Closed on
May 31, 2006
Sold by
Benchmark Custom Homes Inc
Bought by
Peterson Michael L
Create a Home Valuation Report for This Property
The Home Valuation Report is an in-depth analysis detailing your home's value as well as a comparison with similar homes in the area
Home Values in the Area
Average Home Value in this Area
Purchase History
| Date | Buyer | Sale Price | Title Company |
|---|---|---|---|
| Hpa Ii Borrower 2020 1 Llc | -- | Stewart Ttl Guaranty Com Svc | |
| Hpa Us1 Llc | $323,000 | Burnet Title | |
| Jkg Properties Llc | $223,000 | Servicelink Llc | |
| Us Bank Na | $212,500 | None Available | |
| Peterson Michael L | $266,000 | -- |
Source: Public Records
Mortgage History
| Date | Status | Borrower | Loan Amount |
|---|---|---|---|
| Previous Owner | Jkg Properties Llc | $210,400 |
Source: Public Records
Tax History Compared to Growth
Tax History
| Year | Tax Paid | Tax Assessment Tax Assessment Total Assessment is a certain percentage of the fair market value that is determined by local assessors to be the total taxable value of land and additions on the property. | Land | Improvement |
|---|---|---|---|---|
| 2025 | $4,388 | $397,000 | $107,000 | $290,000 |
| 2024 | $4,118 | $382,300 | $102,000 | $280,300 |
| 2023 | $4,118 | $394,300 | $105,900 | $288,400 |
| 2022 | $4,148 | $359,800 | $98,000 | $261,800 |
| 2021 | $3,936 | $307,100 | $70,000 | $237,100 |
| 2020 | $3,794 | $281,600 | $70,000 | $211,600 |
| 2019 | $3,250 | $264,500 | $0 | $0 |
| 2018 | $2,972 | $221,300 | $0 | $0 |
| 2017 | $2,804 | $207,700 | $0 | $0 |
| 2016 | $2,682 | $0 | $0 | $0 |
| 2015 | $2,650 | $0 | $0 | $0 |
| 2014 | -- | $0 | $0 | $0 |
Source: Public Records
Map
Nearby Homes
- 3212 Kady Ave NE
- 3216 Kady Ave NE
- 3214 Kady Ave NE
- 3218 Kady Ave NE
- 3210 Kady Ave NE
- 3291 Kady Ave NE
- 3348 Kady Ave NE
- 3363 Kady Ave NE
- 3381 Kady Ave NE
- 9911 32nd St NE
- 3468 Kachina Ave NE
- 3455 Kahler Dr NE
- 3483 Kady Ave NE
- 3237 Jandura Ave NE
- 10632 29th St NE
- 9770 32nd St NE
- 10624 29th St NE
- 3235 Jandura Ave NE
- 10647 29th St NE
- 10641 29th St NE
- 10186 31st St NE
- 7343 Kaeding Ln NE
- 7333 Kaeding Ln NE
- 7313 Kaeding Ln NE
- 7303 Kaeding Ln NE
- 10205 31st Cir NE
- 3075 Kaeding Ln
- 10172 31st St NE
- 3106 Kaeding Ln
- 3124 Kaeding Ln
- 10177 31st St NE
- 3138 Kaeding Ln
- 3070 3070 Ne Kaeding Ln NE
- 3070 Kaeding Ln
- 3057 Kaeding Ln
- 10149 31st St NE
- 10158 31st St NE
- 3103 Kagen Ave NE
- 3152 Kaeding Ln
- 3115 Kagen Ave NE