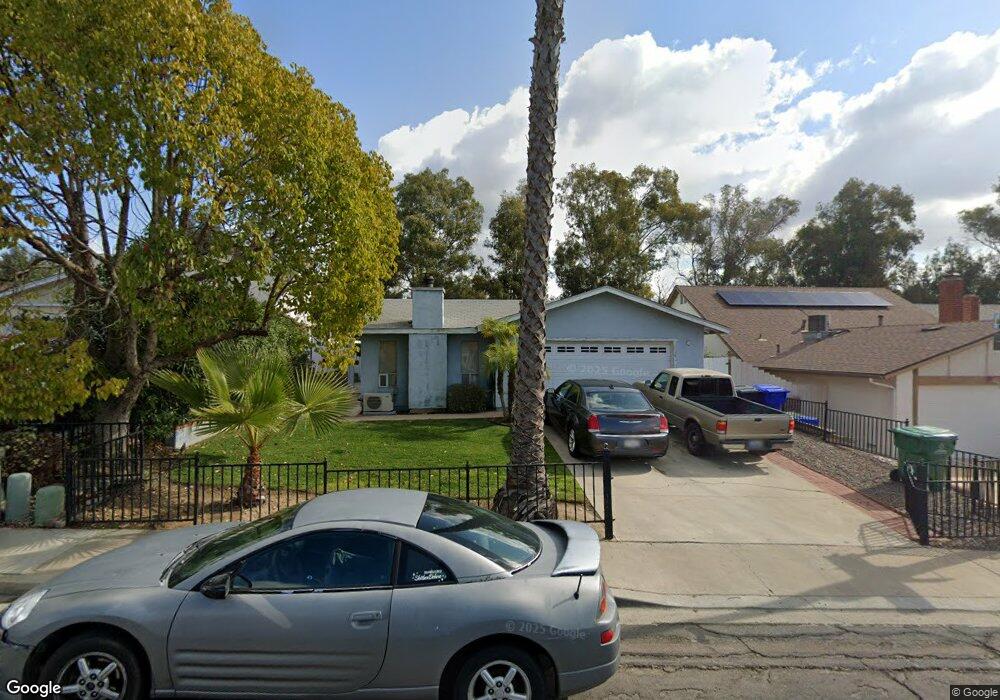
10207 Autumnview Ln San Diego, CA 92126
Mira Mesa NeighborhoodEstimated Value: $1,004,000 - $1,164,000
4
Beds
2
Baths
1,569
Sq Ft
$684/Sq Ft
Est. Value
About This Home
This home is located at 10207 Autumnview Ln, San Diego, CA 92126 and is currently estimated at $1,072,866, approximately $683 per square foot. 10207 Autumnview Ln is a home located in San Diego County with nearby schools including Mason Elementary School, Wangenheim Middle School, and Mira Mesa High School.
Ownership History
Date
Name
Owned For
Owner Type
Purchase Details
Closed on
Oct 18, 2019
Sold by
Musser Thomas B and Musser Cynthia J
Bought by
Musser Thomas B and Musser Cynthia J
Current Estimated Value
Purchase Details
Closed on
Mar 18, 2002
Sold by
Yow Matthew B and Yow Daisy
Bought by
Musser Thomas B and Musser Cynthia J
Home Financials for this Owner
Home Financials are based on the most recent Mortgage that was taken out on this home.
Original Mortgage
$279,000
Outstanding Balance
$114,247
Interest Rate
6.78%
Estimated Equity
$958,619
Purchase Details
Closed on
Sep 29, 1999
Sold by
Yow Mathew B and Yow Matthew B
Bought by
Yow Matthew B and Yow Daisy
Home Financials for this Owner
Home Financials are based on the most recent Mortgage that was taken out on this home.
Original Mortgage
$63,100
Interest Rate
7.56%
Mortgage Type
Credit Line Revolving
Purchase Details
Closed on
Jun 19, 1992
Purchase Details
Closed on
Mar 31, 1989
Purchase Details
Closed on
Sep 3, 1987
Create a Home Valuation Report for This Property
The Home Valuation Report is an in-depth analysis detailing your home's value as well as a comparison with similar homes in the area
Home Values in the Area
Average Home Value in this Area
Purchase History
| Date | Buyer | Sale Price | Title Company |
|---|---|---|---|
| Musser Thomas B | -- | None Available | |
| Musser Thomas B | $310,000 | Commonwealth Land Title Co | |
| Yow Matthew B | -- | First American Title | |
| -- | $171,000 | -- | |
| -- | $160,000 | -- | |
| -- | $128,500 | -- |
Source: Public Records
Mortgage History
| Date | Status | Borrower | Loan Amount |
|---|---|---|---|
| Open | Musser Thomas B | $279,000 | |
| Previous Owner | Yow Matthew B | $63,100 |
Source: Public Records
Tax History Compared to Growth
Tax History
| Year | Tax Paid | Tax Assessment Tax Assessment Total Assessment is a certain percentage of the fair market value that is determined by local assessors to be the total taxable value of land and additions on the property. | Land | Improvement |
|---|---|---|---|---|
| 2025 | $5,480 | $457,940 | $280,676 | $177,264 |
| 2024 | $5,480 | $448,962 | $275,173 | $173,789 |
| 2023 | $5,357 | $440,160 | $269,778 | $170,382 |
| 2022 | $5,212 | $431,531 | $264,489 | $167,042 |
| 2021 | $5,174 | $423,070 | $259,303 | $163,767 |
| 2020 | $5,111 | $418,733 | $256,645 | $162,088 |
| 2019 | $5,018 | $410,523 | $251,613 | $158,910 |
| 2018 | $4,691 | $402,475 | $246,680 | $155,795 |
| 2017 | $80 | $394,585 | $241,844 | $152,741 |
| 2016 | $4,500 | $386,849 | $237,102 | $149,747 |
| 2015 | $4,433 | $381,039 | $233,541 | $147,498 |
| 2014 | $4,362 | $373,576 | $228,967 | $144,609 |
Source: Public Records
Map
Nearby Homes
- 10422 Londonderry Ave
- 10284 Black Mountain Rd Unit 198
- 10222 Black Mountain Rd Unit 69
- 10226 Black Mountain Rd Unit 78
- 10296 Black Mountain Rd Unit 220
- 10249 Black Mountain Rd Unit Q3
- 10582 Caminito Glenellen
- 10573 Caminito Flores
- 9504 Carroll Canyon Rd Unit 202
- 10265 Eagle Rock Ave
- 8516 Flanders Dr
- 10026 Maya Linda Rd Unit 6101
- 10076 Maya Linda Rd Unit 1101
- 10112 Caminito Volar
- 10224 Maya Linda Rd Unit 17
- 9785 Mesa Springs Way Unit 74
- 9725 Mesa Springs Way Unit 176
- 8670 New Salem St Unit 106
- 9755 Mesa Springs Way Unit 126
- 10166 Camino Ruiz Unit 32
- 10195 Autumnview Ln
- 10217 Autumnview Ln
- 10185 Autumnview Ln
- 10227 Autumnview Ln
- 10208 Autumnview Ln
- 10175 Autumnview Ln
- 8987 Fallwood Ave
- 10218 Autumnview Ln
- 10237 Autumnview Ln
- 10165 Autumnview Ln
- 8977 Fallwood Ave
- 10238 Autumnview Ln
- 10228 Autumnview Ln
- 10217 Fall Glen Ct
- 10217 Fallglen Ct
- 8988 Jade Coast Ln
- 10207 Fallglen Ct
- 8967 Fallwood Ave
- 10155 Autumnview Ln
- 8978 Jade Coast Ln