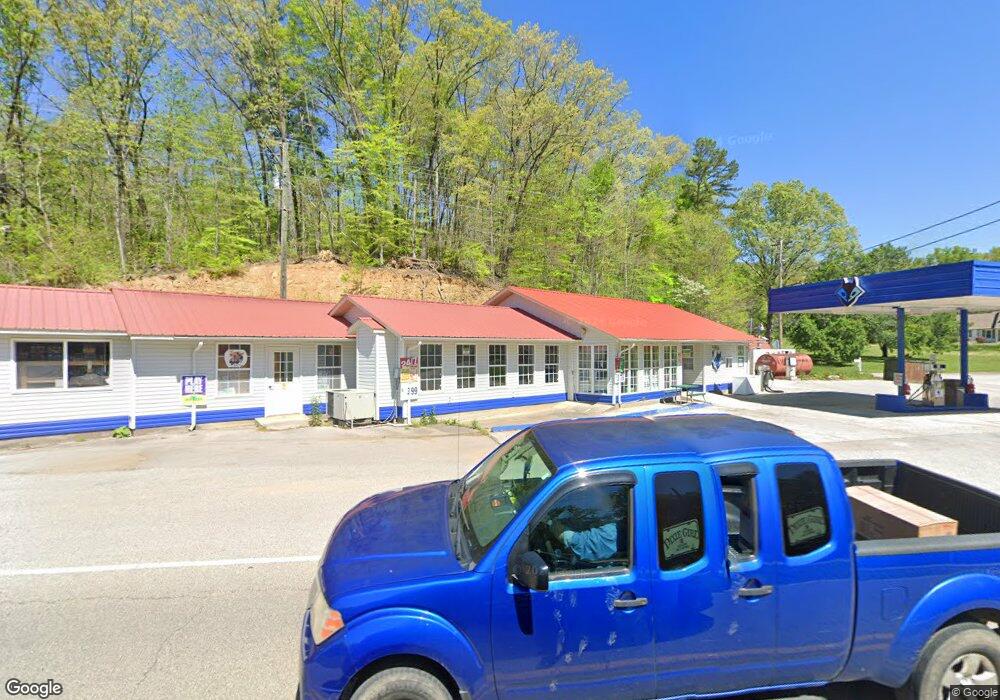
10208 Petros Hwy Oliver Springs, TN 37840
Estimated Value: $643,761
--
Bed
--
Bath
2,500
Sq Ft
$258/Sq Ft
Est. Value
About This Home
This home is located at 10208 Petros Hwy, Oliver Springs, TN 37840 and is currently priced at $643,761, approximately $257 per square foot. 10208 Petros Hwy is a home located in Morgan County with nearby schools including Petros Joyner Elementary School and Coalfield School.
Ownership History
Date
Name
Owned For
Owner Type
Purchase Details
Closed on
Mar 9, 2023
Sold by
Standard Development Company Llc
Bought by
Crh Ii Llc
Current Estimated Value
Home Financials for this Owner
Home Financials are based on the most recent Mortgage that was taken out on this home.
Original Mortgage
$8,714,580
Outstanding Balance
$8,146,686
Interest Rate
6.65%
Mortgage Type
New Conventional
Purchase Details
Closed on
Dec 16, 2022
Sold by
Jay Aambe Llc
Bought by
Standard Development Company Llc
Purchase Details
Closed on
May 25, 2021
Sold by
Patel Khusboo
Bought by
Jay Aambe Llc
Home Financials for this Owner
Home Financials are based on the most recent Mortgage that was taken out on this home.
Original Mortgage
$144,802
Interest Rate
2.9%
Mortgage Type
Seller Take Back
Purchase Details
Closed on
Mar 5, 2020
Sold by
Duncan Joe R
Bought by
Patel Khusboo
Purchase Details
Closed on
Dec 5, 2002
Bought by
Duncan Joe R and Duncan Judy L
Create a Home Valuation Report for This Property
The Home Valuation Report is an in-depth analysis detailing your home's value as well as a comparison with similar homes in the area
Home Values in the Area
Average Home Value in this Area
Purchase History
| Date | Buyer | Sale Price | Title Company |
|---|---|---|---|
| Crh Ii Llc | $1,500,000 | Professional Land Title | |
| Standard Development Company Llc | $1,075,000 | Professional Land Title | |
| Standard Development Company Llc | $180,000 | National Title & Escrow | |
| Jay Aambe Llc | $200,000 | Admiral Title Inc | |
| Patel Khusboo | $180,000 | Admiral Title Inc | |
| Duncan Joe R | -- | -- |
Source: Public Records
Mortgage History
| Date | Status | Borrower | Loan Amount |
|---|---|---|---|
| Open | Crh Ii Llc | $8,714,580 | |
| Previous Owner | Jay Aambe Llc | $144,802 |
Source: Public Records
Tax History Compared to Growth
Tax History
| Year | Tax Paid | Tax Assessment Tax Assessment Total Assessment is a certain percentage of the fair market value that is determined by local assessors to be the total taxable value of land and additions on the property. | Land | Improvement |
|---|---|---|---|---|
| 2024 | $2,268 | $83,400 | $4,760 | $78,640 |
| 2023 | $1,973 | $72,560 | $4,760 | $67,800 |
| 2022 | $1,973 | $72,560 | $4,760 | $67,800 |
| 2021 | $1,973 | $72,560 | $4,760 | $67,800 |
| 2020 | $1,983 | $72,560 | $4,760 | $67,800 |
| 2019 | $1,983 | $60,640 | $7,880 | $52,760 |
| 2018 | $1,983 | $60,640 | $7,880 | $52,760 |
| 2017 | $1,916 | $60,640 | $7,880 | $52,760 |
| 2016 | $1,916 | $60,640 | $7,880 | $52,760 |
| 2015 | $1,880 | $60,640 | $7,880 | $52,760 |
| 2014 | $1,463 | $47,200 | $4,240 | $42,960 |
Source: Public Records
Map
Nearby Homes
- 9533 Petros Hwy
- 103 Duncan Woods Rd
- 125 Gill Burgess Rd
- 4716 Knoxville Hwy
- 155 Mountain Vista Rd
- 225 Meadow Dr
- 183 Meadow Dr
- 117 & 119 E C Noe Rd
- 2992 Knoxville Hwy
- 213 Cedar Ridge Rd
- 0 Petit Ln
- 778 Cassell Rd
- 322 Spruce Dr
- 1534 Cove Ln
- 1384 Coal Hill Rd
- 118 Jones Rd
- 2919 Morgan County Hwy
- 118 Authorn Sheldon Rd
- 0000 Ray Cross Rd
- Tr 1 Hollow Ct
- 10034 Petros Hwy Unit 10034
- 10229 Petros Hwy Unit 10229
- 10217 Petros Hwy Unit 10217
- 116 Water Tank Rd
- 104 Water Tank Rd
- 141 Water Tank Rd
- 10222 Petros Hwy Unit 10222
- 10205 Petros Hwy Unit 10205
- 0 St Rt 116 Tn Unit RTC2849561
- 0 St Rt 116 Tn Unit 1089748
- 10108 Petros Hwy
- 118 Water Tank Rd
- 10112 Petros Hwy
- 0 Water Tank Rd
- 10304 Petros Hwy
- 10305 Petros Hwy
- 219 Water Tank Rd
- 741 Back Petros Rd
- 10315 Petros Hwy Unit 10315
- 719 Back Petros Rd