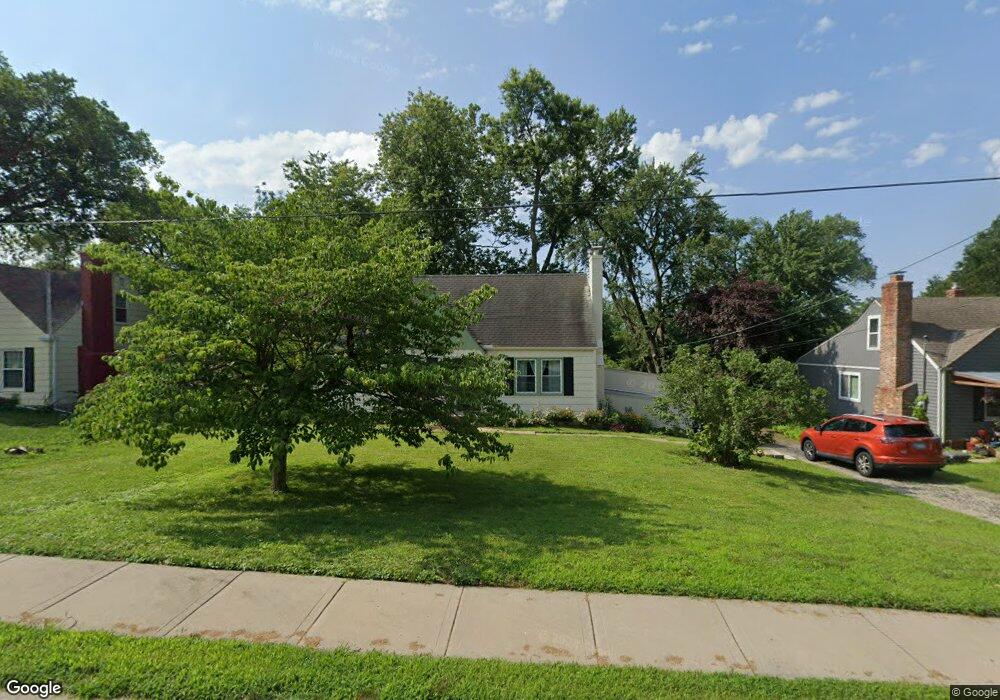
10209 W 60th Terrace Shawnee, KS 66203
Estimated Value: $264,000 - $327,000
3
Beds
2
Baths
1,290
Sq Ft
$228/Sq Ft
Est. Value
About This Home
This home is located at 10209 W 60th Terrace, Shawnee, KS 66203 and is currently estimated at $294,238, approximately $228 per square foot. 10209 W 60th Terrace is a home located in Johnson County with nearby schools including Merriam Park Elementary School, Hocker Grove Middle School, and Shawnee Mission North High School.
Ownership History
Date
Name
Owned For
Owner Type
Purchase Details
Closed on
Nov 8, 2012
Sold by
Gwin Timothy M and Gwin Angela M
Bought by
Gwin Angela M
Current Estimated Value
Home Financials for this Owner
Home Financials are based on the most recent Mortgage that was taken out on this home.
Original Mortgage
$141,928
Outstanding Balance
$97,770
Interest Rate
3.4%
Mortgage Type
New Conventional
Estimated Equity
$196,468
Purchase Details
Closed on
Sep 11, 2012
Sold by
Gwinn Timothy M
Bought by
Gwin Timothy M and Gwin Angela M
Home Financials for this Owner
Home Financials are based on the most recent Mortgage that was taken out on this home.
Original Mortgage
$141,928
Outstanding Balance
$97,770
Interest Rate
3.4%
Mortgage Type
New Conventional
Estimated Equity
$196,468
Purchase Details
Closed on
Jun 15, 2011
Sold by
Gwin Angela Marie
Bought by
Gwinn Timothy Marc
Create a Home Valuation Report for This Property
The Home Valuation Report is an in-depth analysis detailing your home's value as well as a comparison with similar homes in the area
Home Values in the Area
Average Home Value in this Area
Purchase History
| Date | Buyer | Sale Price | Title Company |
|---|---|---|---|
| Gwin Angela M | -- | None Available | |
| Gwin Timothy M | -- | -- | |
| Gwinn Timothy Marc | -- | None Available |
Source: Public Records
Mortgage History
| Date | Status | Borrower | Loan Amount |
|---|---|---|---|
| Open | Gwin Angela M | $141,928 |
Source: Public Records
Tax History Compared to Growth
Tax History
| Year | Tax Paid | Tax Assessment Tax Assessment Total Assessment is a certain percentage of the fair market value that is determined by local assessors to be the total taxable value of land and additions on the property. | Land | Improvement |
|---|---|---|---|---|
| 2024 | $3,171 | $29,555 | $6,149 | $23,406 |
| 2023 | $2,939 | $27,796 | $5,127 | $22,669 |
| 2022 | $2,669 | $24,357 | $5,127 | $19,230 |
| 2021 | $2,494 | $21,666 | $4,661 | $17,005 |
| 2020 | $2,274 | $19,631 | $4,237 | $15,394 |
| 2019 | $2,003 | $17,330 | $3,681 | $13,649 |
| 2018 | $1,737 | $15,008 | $3,349 | $11,659 |
| 2017 | $1,565 | $13,294 | $3,349 | $9,945 |
| 2016 | $1,536 | $12,961 | $3,349 | $9,612 |
| 2015 | $1,507 | $12,800 | $3,349 | $9,451 |
| 2013 | -- | $12,846 | $3,349 | $9,497 |
Source: Public Records
Map
Nearby Homes
- 6420 Ballentine St
- 10120 W 65th St
- The Fleetwood Plan at Bristol Highlands - The Villas
- The Fleetwood Plan at Bristol Highlands - The Manors
- The Kirkwood Plan at Bristol Highlands - The Villas
- 8013 Payne St
- The Rockwood Plan at Bristol Highlands - The Villas
- 11002 W 55th Terrace
- 5517 Hayes St
- 10924 W 67th St
- 9719 W 53rd St
- 10116 W 52nd Terrace
- 8510 W 61st St
- 5308 Mcanany Dr
- 5220 Hayes St
- 6213 Terrydale St
- 10235 W 70th St
- 8613 W 54th Terrace
- 11407 W 68th Terrace
- 12116 W 63rd Terrace
- 10205 W 60th Terrace
- 10215 W 60th Terrace
- 10125 W 60th Terrace
- 10225 W 60th Terrace
- 10212 W 60th Terrace
- 10206 W 60th Terrace
- 10216 W 60th Terrace
- 10124 W 60th Terrace
- 10115 W 60th Terrace
- 10224 W 60th Terrace
- 10206 W 61st St
- 10218 W 61st St
- 10302 W 60th Terrace
- 10109 W 60th Terrace
- 6032 Mastin St
- 10121 W 59th Terrace
- 10136 W 61st St
- 10224 W 61st St
- 10117 W 59th Terrace
- 10113 W 59th Terrace