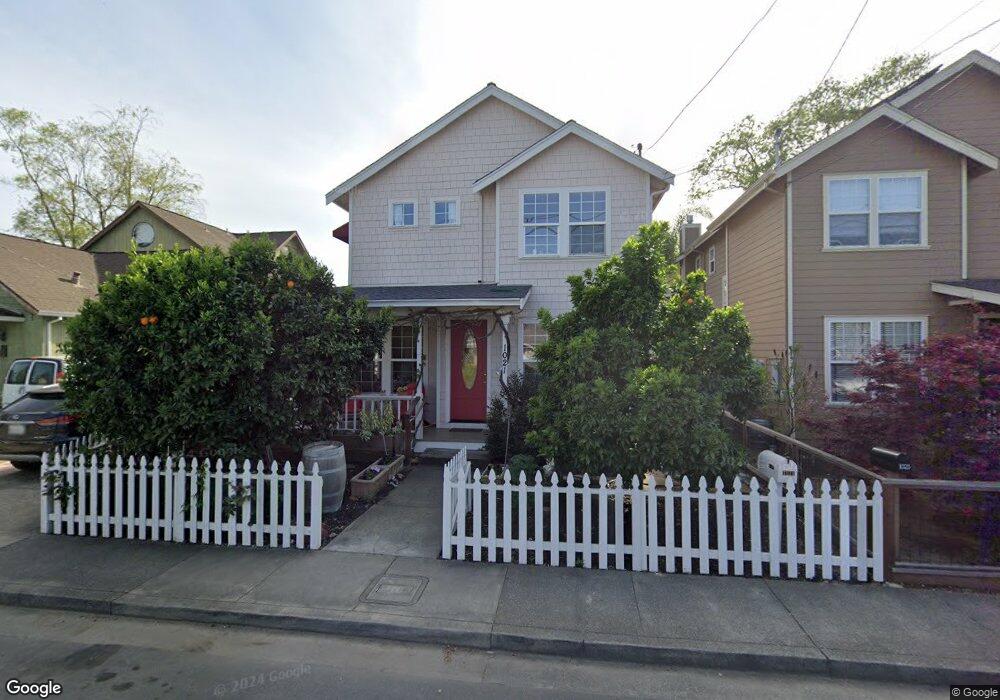
1021 Allison Ave Saint Helena, CA 94574
Estimated Value: $1,264,618 - $1,492,000
3
Beds
3
Baths
1,671
Sq Ft
$820/Sq Ft
Est. Value
About This Home
This home is located at 1021 Allison Ave, Saint Helena, CA 94574 and is currently estimated at $1,369,905, approximately $819 per square foot. 1021 Allison Ave is a home located in Napa County with nearby schools including Saint Helena Elementary School, Saint Helena Primary School, and Robert Louis Stevenson Intermediate School.
Ownership History
Date
Name
Owned For
Owner Type
Purchase Details
Closed on
Jan 27, 2015
Sold by
Henry Richard A and Henry Cheryl L
Bought by
The Henry Family Trust
Current Estimated Value
Purchase Details
Closed on
Nov 13, 2002
Sold by
Pape Larry M and Debeni Larry A
Bought by
Henry Richard A and Henry Cheryl L
Home Financials for this Owner
Home Financials are based on the most recent Mortgage that was taken out on this home.
Original Mortgage
$476,000
Outstanding Balance
$191,733
Interest Rate
5.5%
Estimated Equity
$1,178,172
Purchase Details
Closed on
Sep 12, 2001
Sold by
Hasty Steve and Hasty Johanna
Bought by
Pape Larry M and Debeni Larry A
Purchase Details
Closed on
Sep 11, 2001
Sold by
Pape Darlette
Bought by
Pape Larry M
Create a Home Valuation Report for This Property
The Home Valuation Report is an in-depth analysis detailing your home's value as well as a comparison with similar homes in the area
Home Values in the Area
Average Home Value in this Area
Purchase History
| Date | Buyer | Sale Price | Title Company |
|---|---|---|---|
| The Henry Family Trust | -- | None Available | |
| Henry Richard A | $595,000 | Napa Land Title Company | |
| Pape Larry M | $265,000 | First American Title Co | |
| Pape Larry M | -- | First American Title Co |
Source: Public Records
Mortgage History
| Date | Status | Borrower | Loan Amount |
|---|---|---|---|
| Open | Henry Richard A | $476,000 | |
| Closed | Henry Richard A | $59,500 |
Source: Public Records
Tax History Compared to Growth
Tax History
| Year | Tax Paid | Tax Assessment Tax Assessment Total Assessment is a certain percentage of the fair market value that is determined by local assessors to be the total taxable value of land and additions on the property. | Land | Improvement |
|---|---|---|---|---|
| 2025 | $8,963 | $861,738 | $405,523 | $456,215 |
| 2024 | $8,963 | $844,842 | $397,572 | $447,270 |
| 2023 | $8,963 | $828,277 | $389,777 | $438,500 |
| 2022 | $8,512 | $812,037 | $382,135 | $429,902 |
| 2021 | $8,398 | $796,116 | $374,643 | $421,473 |
| 2020 | $8,313 | $787,954 | $370,802 | $417,152 |
| 2019 | $8,167 | $772,505 | $363,532 | $408,973 |
| 2018 | $8,034 | $757,358 | $356,404 | $400,954 |
| 2017 | $7,882 | $742,509 | $349,416 | $393,093 |
| 2016 | $7,706 | $727,951 | $342,565 | $385,386 |
| 2015 | $7,646 | $717,018 | $337,420 | $379,598 |
| 2014 | $6,976 | $647,900 | $304,700 | $343,200 |
Source: Public Records
Map
Nearby Homes
- 1003 Charter Oak Ave
- 844 Signorelli Cir
- 945 Hunt Ave
- 1123 Oak Ave
- 613 Harvest Ln
- 1133 Oak Ave
- 1430 Wallis Ct
- 1233 Kearney St
- 1240 Peppertree Cir
- 1503 Tainter St
- 1551 Spring St
- 8 San Lucas Ct
- 24 San Lucas Ct
- 1209 Stockton St
- 1243 Stockton St
- 4 La Canada Ct
- 2 La Cuesta Ct
- 1664 Spring St
- 1711 Spring St
- 1467 Kearney St
- 1025 Allison Ave
- 1015 Allison Ave
- 930 Brown St
- 1039 Allison Ave
- 910 Brown St
- 932 Brown St
- 980 Allison Ave
- 1012 Allison Ave
- 1018 Allison Ave
- 940 Brown St
- 907 Pope St
- 1014 Allison Ave
- 935 Allison Ave
- 990 Allison Ave
- 946 Brown St
- 915 Brown St
- 974 Allison Ave
- 933 Brown St
- 925 Allison Ave
- 943 Mariposa Ln