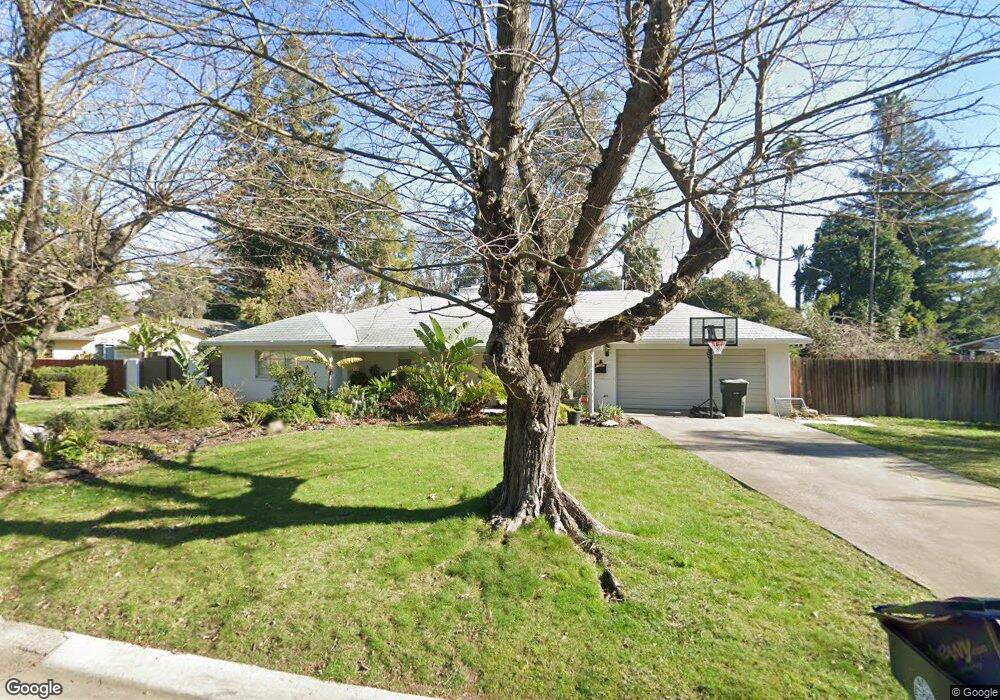
1021 Appollo Way Sacramento, CA 95822
Little Pocket NeighborhoodEstimated Value: $535,000 - $773,265
2
Beds
2
Baths
1,740
Sq Ft
$401/Sq Ft
Est. Value
About This Home
This home is located at 1021 Appollo Way, Sacramento, CA 95822 and is currently estimated at $697,816, approximately $401 per square foot. 1021 Appollo Way is a home located in Sacramento County with nearby schools including John Cabrillo Elementary School, Sam Brannan Middle School, and John F. Kennedy High School.
Ownership History
Date
Name
Owned For
Owner Type
Purchase Details
Closed on
Dec 5, 2024
Sold by
Steele Erik and Steele Janine
Bought by
Steele Living Trust and Steele
Current Estimated Value
Purchase Details
Closed on
Dec 7, 2015
Sold by
Fong Ava J
Bought by
Steele Erik and Steele Janine
Home Financials for this Owner
Home Financials are based on the most recent Mortgage that was taken out on this home.
Original Mortgage
$324,000
Interest Rate
3.71%
Mortgage Type
New Conventional
Purchase Details
Closed on
Oct 27, 2009
Sold by
Fong Jeff E and Fong Ava J
Bought by
Fong Ava J
Purchase Details
Closed on
Mar 30, 2006
Sold by
Dennis Betty Jane and The Betty Jane Dennis Family T
Bought by
Fong Jeff E and Fong Ava J
Purchase Details
Closed on
Sep 20, 2004
Sold by
Haines Betty J and Haines Dennis Betty
Bought by
Dennis Betty Jane and Betty Jane Dennis Family Trust
Create a Home Valuation Report for This Property
The Home Valuation Report is an in-depth analysis detailing your home's value as well as a comparison with similar homes in the area
Home Values in the Area
Average Home Value in this Area
Purchase History
| Date | Buyer | Sale Price | Title Company |
|---|---|---|---|
| Steele Living Trust | -- | None Listed On Document | |
| Steele Living Trust | -- | None Listed On Document | |
| Steele Erik | $440,000 | Placer Title Company | |
| Fong Ava J | -- | None Available | |
| Fong Jeff E | $485,000 | Cornerstone Title Co | |
| Dennis Betty Jane | -- | -- |
Source: Public Records
Mortgage History
| Date | Status | Borrower | Loan Amount |
|---|---|---|---|
| Previous Owner | Steele Erik | $324,000 |
Source: Public Records
Tax History Compared to Growth
Tax History
| Year | Tax Paid | Tax Assessment Tax Assessment Total Assessment is a certain percentage of the fair market value that is determined by local assessors to be the total taxable value of land and additions on the property. | Land | Improvement |
|---|---|---|---|---|
| 2025 | $6,917 | $583,287 | $255,697 | $327,590 |
| 2024 | $6,917 | $571,851 | $250,684 | $321,167 |
| 2023 | $6,748 | $560,639 | $245,769 | $314,870 |
| 2022 | $5,976 | $490,823 | $240,950 | $249,873 |
| 2021 | $5,688 | $481,200 | $236,226 | $244,974 |
| 2020 | $5,733 | $476,267 | $233,804 | $242,463 |
| 2019 | $5,612 | $466,929 | $229,220 | $237,709 |
| 2018 | $5,468 | $457,775 | $224,726 | $233,049 |
| 2017 | $5,389 | $448,800 | $220,320 | $228,480 |
| 2016 | $5,277 | $440,000 | $216,000 | $224,000 |
| 2015 | $4,952 | $412,000 | $154,500 | $257,500 |
| 2014 | $4,703 | $400,000 | $150,000 | $250,000 |
Source: Public Records
Map
Nearby Homes
- 1050 Appollo Way
- 995 Piedmont Dr
- 5081 Karbet Way
- 1122 28th Ave
- 936 Roeder Way
- 4801 da Rosa Dr
- 4580 S River Rd
- 5720 Riverside Blvd
- 5716 Lonsdale Dr
- 1220 Lucio Ln
- 5440 Pleasant Dr
- 80 Petrilli Cir
- 4271 Warren Ave
- 5200 Pleasant Dr
- 1224 Nevis Ct
- 5779 Gloria Dr
- 4500 Crestwood Way
- 5880 Gloria Dr
- 1088 Woodshire Way
- 5875 Gloria Dr Unit 4
- 1031 Appollo Way
- 1015 Appollo Way
- 1041 Appollo Way
- 1020 Piedmont Dr
- 1030 Piedmont Dr
- 1000 Piedmont Dr
- 1024 Appollo Way
- 1020 Appollo Way
- 1016 Appollo Way
- 1030 Appollo Way
- 1051 Appollo Way
- 1012 Appollo Way
- 1006 Appollo Way
- 1040 Appollo Way
- 1040 Piedmont Dr
- 1061 Appollo Way
- 1011 Casilada Way
- 1021 Casilada Way
- 1050 Piedmont Dr
- 1001 Casilada Way