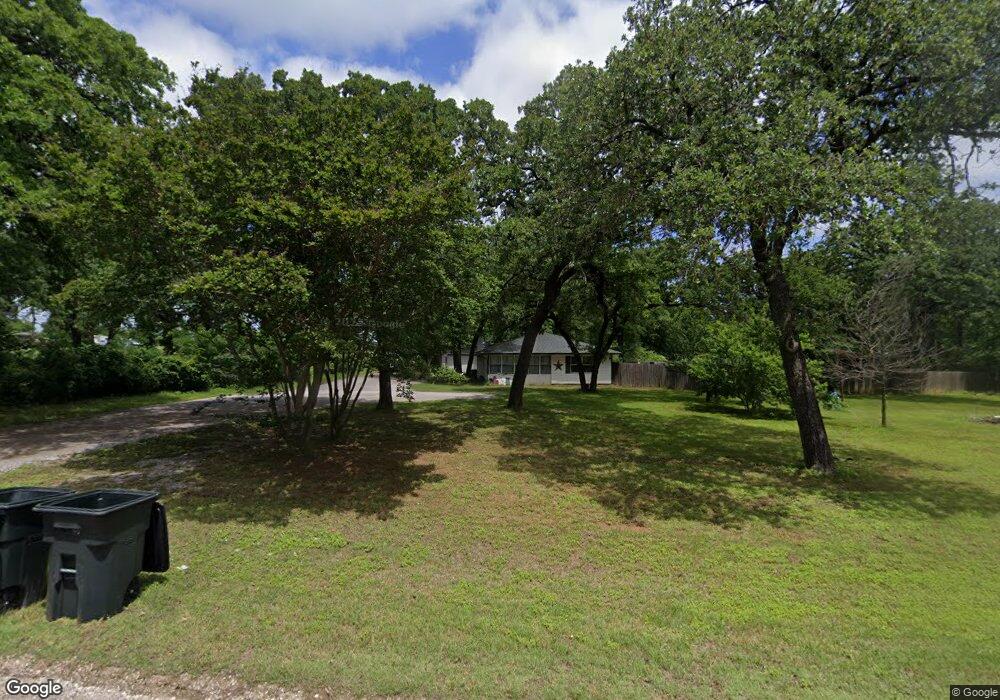
1021 County Road 705 Joshua, TX 76058
Estimated Value: $349,055 - $456,000
3
Beds
2
Baths
1,824
Sq Ft
$222/Sq Ft
Est. Value
About This Home
This home is located at 1021 County Road 705, Joshua, TX 76058 and is currently estimated at $404,764, approximately $221 per square foot. 1021 County Road 705 is a home located in Johnson County with nearby schools including Plum Creek Elementary School, Joshua High School - 9th Grade Campus, and Joshua High School.
Ownership History
Date
Name
Owned For
Owner Type
Purchase Details
Closed on
Oct 17, 2016
Sold by
Maddux Housing Llc
Bought by
Could Steven B and Could Cynthia K
Current Estimated Value
Home Financials for this Owner
Home Financials are based on the most recent Mortgage that was taken out on this home.
Original Mortgage
$186,558
Outstanding Balance
$151,474
Interest Rate
3.87%
Mortgage Type
FHA
Estimated Equity
$253,290
Purchase Details
Closed on
May 2, 2016
Sold by
Calliocutt John C and Callicutt Susan R
Bought by
Maddux Housing 2 Llc
Home Financials for this Owner
Home Financials are based on the most recent Mortgage that was taken out on this home.
Original Mortgage
$59,500
Interest Rate
3.73%
Mortgage Type
Construction
Purchase Details
Closed on
Feb 25, 2010
Sold by
Hubert Linda K
Bought by
Hubert Linda K and Phelps Donna J
Create a Home Valuation Report for This Property
The Home Valuation Report is an in-depth analysis detailing your home's value as well as a comparison with similar homes in the area
Home Values in the Area
Average Home Value in this Area
Purchase History
| Date | Buyer | Sale Price | Title Company |
|---|---|---|---|
| Could Steven B | -- | Providence Title Co | |
| Maddux Housing 2 Llc | -- | Providence Title Co | |
| Hubert Linda K | -- | None Available |
Source: Public Records
Mortgage History
| Date | Status | Borrower | Loan Amount |
|---|---|---|---|
| Open | Could Steven B | $186,558 | |
| Previous Owner | Maddux Housing 2 Llc | $59,500 |
Source: Public Records
Tax History Compared to Growth
Tax History
| Year | Tax Paid | Tax Assessment Tax Assessment Total Assessment is a certain percentage of the fair market value that is determined by local assessors to be the total taxable value of land and additions on the property. | Land | Improvement |
|---|---|---|---|---|
| 2025 | $2,626 | $150,547 | $85,000 | $65,547 |
| 2024 | $2,626 | $150,547 | $85,000 | $65,547 |
| 2023 | $2,055 | $130,547 | $65,000 | $65,547 |
| 2022 | $2,347 | $130,547 | $65,000 | $65,547 |
| 2021 | $1,921 | $0 | $0 | $0 |
| 2020 | $1,786 | $0 | $0 | $0 |
| 2019 | $1,903 | $0 | $0 | $0 |
| 2018 | $1,746 | $0 | $0 | $0 |
| 2017 | $1,745 | $0 | $0 | $0 |
| 2016 | $1,745 | $0 | $0 | $0 |
| 2015 | $1,581 | $0 | $0 | $0 |
| 2014 | $1,581 | $80,047 | $14,500 | $65,547 |
Source: Public Records
Map
Nearby Homes
- 1301 County Road 705
- 7016 Valley View Dr
- 7008 Valley View Dr
- 7004 Valley View Dr
- 6020 Glenwood Dr
- 4433 County Road 801
- 4012 Twin Hills Ct
- 5012 Pheasant Run Dr
- 239 Ranch Rd
- 6013 Valley View Dr
- 3012 Valley View Dr
- 208 Ranch Rd
- 3004 Valley View Dr
- 4208 N Main St
- 4120 County Road 801
- 3956 Redbird Ln
- Scottsdale II Plan at Joshua Meadows
- Lexington SE Plan at Joshua Meadows
- Nottingham I Plan at Joshua Meadows
- Fairview SE Plan at Joshua Meadows
- 1029 County Road 705
- 1029 County Road 705
- 965 County Road 705
- 1031 County Road 705
- 1015 County Road 705
- 1024 County Road 705
- 1009 County Road 705
- 1100 County Road 705
- 1004 County Road 705
- 1001 County Road 705
- 1121 County Road 705
- 1125 County Road 705
- 1200 County Road 705
- 1211 County Road 705
- 829 County Road 705
- 817 County Road 705
- 1300 County Road 705
- 825 County Road 705
- 825 County Road 705
- 7024 Valley View Dr