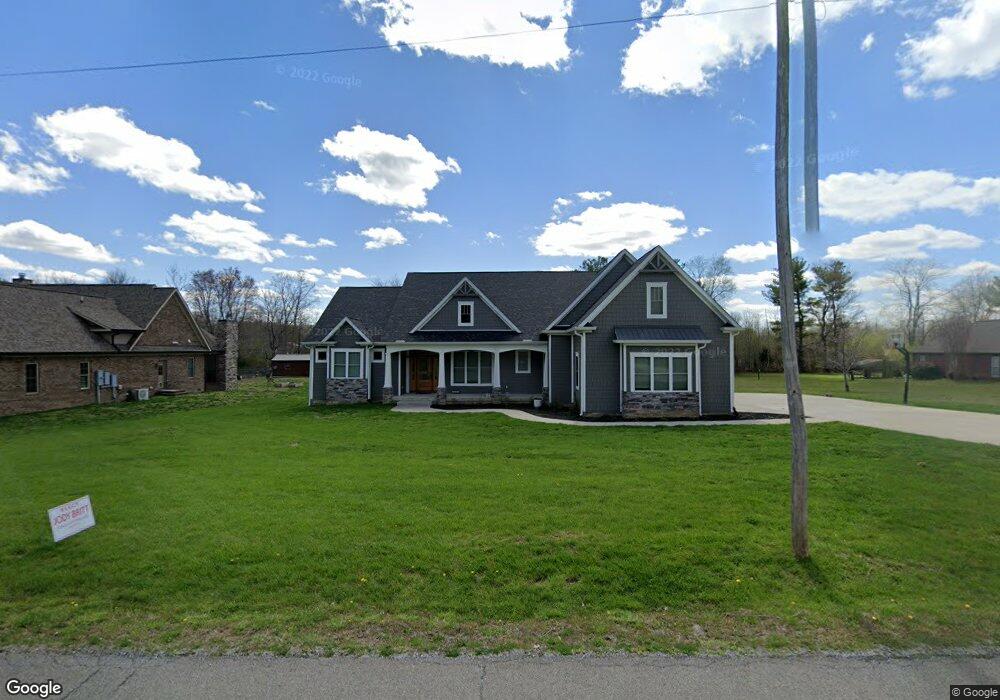
1021 Glendale Dr Dickson, TN 37055
Estimated Value: $511,000 - $657,000
--
Bed
1
Bath
2,583
Sq Ft
$229/Sq Ft
Est. Value
About This Home
This home is located at 1021 Glendale Dr, Dickson, TN 37055 and is currently estimated at $591,504, approximately $228 per square foot. 1021 Glendale Dr is a home with nearby schools including Centennial Elementary School, Dickson Middle School, and Dickson County High School.
Ownership History
Date
Name
Owned For
Owner Type
Purchase Details
Closed on
Apr 23, 2019
Sold by
Britt Shannon Lyle
Bought by
Britt Jody W and Britt Shannon L
Current Estimated Value
Home Financials for this Owner
Home Financials are based on the most recent Mortgage that was taken out on this home.
Original Mortgage
$361,600
Outstanding Balance
$315,951
Interest Rate
4%
Mortgage Type
New Conventional
Estimated Equity
$275,553
Purchase Details
Closed on
Dec 7, 2017
Sold by
Brady Steve
Bought by
Britt Shannon Lyle and Britt Jody Wayne
Purchase Details
Closed on
Mar 19, 2010
Sold by
Community Bank
Bought by
Hamilton Donnie G
Purchase Details
Closed on
Jul 31, 2003
Sold by
Garton Stephen W
Bought by
Hodges & Sons Inc
Purchase Details
Closed on
Apr 6, 1992
Bought by
Garton Glenda Sue
Purchase Details
Closed on
Apr 4, 1986
Bought by
Garton Jeffrey Lynn and Garton Glenda
Create a Home Valuation Report for This Property
The Home Valuation Report is an in-depth analysis detailing your home's value as well as a comparison with similar homes in the area
Home Values in the Area
Average Home Value in this Area
Purchase History
| Date | Buyer | Sale Price | Title Company |
|---|---|---|---|
| Britt Jody W | -- | -- | |
| Britt Shannon Lyle | -- | -- | |
| Hamilton Donnie G | $13,500 | -- | |
| Hodges & Sons Inc | $10,000 | -- | |
| Garton Glenda Sue | -- | -- | |
| Garton Jeffrey Lynn | -- | -- |
Source: Public Records
Mortgage History
| Date | Status | Borrower | Loan Amount |
|---|---|---|---|
| Open | Britt Jody W | $361,600 |
Source: Public Records
Tax History Compared to Growth
Tax History
| Year | Tax Paid | Tax Assessment Tax Assessment Total Assessment is a certain percentage of the fair market value that is determined by local assessors to be the total taxable value of land and additions on the property. | Land | Improvement |
|---|---|---|---|---|
| 2024 | $3,522 | $158,925 | $11,250 | $147,675 |
| 2023 | $3,522 | $112,775 | $8,000 | $104,775 |
| 2022 | $3,522 | $112,775 | $8,000 | $104,775 |
| 2021 | $3,522 | $112,775 | $8,000 | $104,775 |
| 2020 | $3,522 | $112,775 | $8,000 | $104,775 |
| 2019 | $250 | $8,000 | $8,000 | $0 |
| 2018 | $137 | $3,750 | $3,750 | $0 |
| 2017 | $137 | $3,750 | $3,750 | $0 |
| 2016 | $228 | $3,750 | $3,750 | $0 |
| 2015 | $242 | $6,250 | $6,250 | $0 |
| 2014 | $242 | $6,250 | $6,250 | $0 |
Source: Public Records
Map
Nearby Homes
- 906 Highway 48 S
- 2620 Highway 48 S
- 121 Regency Ln
- 501 Poplar Bend
- 124 W Piney Rd
- 146 Sherron Dr
- 153 Baggett Ln
- 127 Sherron Dr
- 829 Furnace Hollow Rd
- 0 Furnace Hollow Rd Unit RTC3001315
- 0 Furnace Hollow Rd Unit RTC3001314
- 0 Furnace Hollow Rd Unit RTC3001313
- 0 Furnace Hollow Rd Unit RTC3001312
- 0 Furnace Hollow Rd Unit RTC3001310
- 0 Furnace Hollow Rd Unit RTC3001307
- 0 Furnace Hollow Rd Unit RTC2940727
- 0 Furnace Hollow Rd
- 105 Tices Spring Ct
- 430 Center Ave
- 422 High St
- 1019 Glendale Dr
- 1025 Glendale Dr
- 1022 Glendale Dr
- 1017 Glendale Dr
- 1020 Glendale Dr
- 1016 Glendale Dr
- 1015 Glendale Dr
- 1039 Glendale Dr
- 1030 Glendale Dr
- 134 Eno Rd
- 119 Sullivan Rd
- 1014 Glendale Dr
- 1047 Glendale Dr
- 123 Sullivan Rd
- 908 Highway 48 S
- 1046 Glendale Dr
- 120 Eno Rd
- 122 Eno Rd
- 118 Eno Rd
- 124 Eno Rd