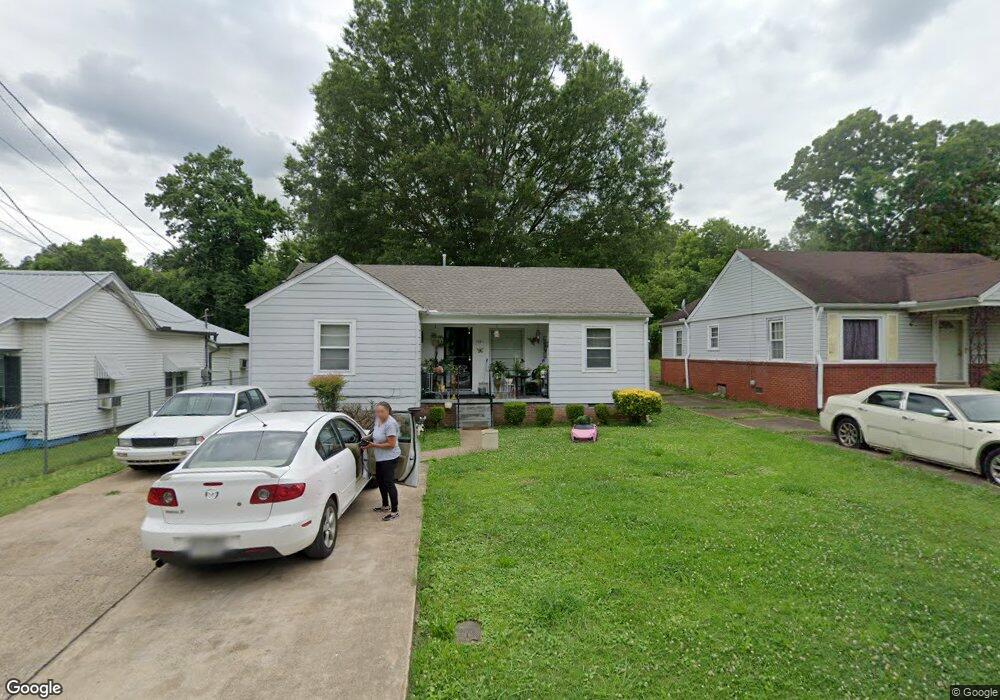
1021 Martin St Jackson, TN 38301
Estimated Value: $48,000 - $63,000
--
Bed
1
Bath
793
Sq Ft
$71/Sq Ft
Est. Value
About This Home
This home is located at 1021 Martin St, Jackson, TN 38301 and is currently estimated at $56,462, approximately $71 per square foot. 1021 Martin St is a home located in Madison County with nearby schools including Alexander Elementary School, North Parkway Middle School, and South Side High School.
Ownership History
Date
Name
Owned For
Owner Type
Purchase Details
Closed on
Aug 29, 2017
Sold by
Home Buyers Inc
Bought by
Mitchell Larry Rosko and Mitchell Freddie L
Current Estimated Value
Purchase Details
Closed on
Feb 14, 2007
Sold by
Ben Curlin
Bought by
Home Buyers Inc
Purchase Details
Closed on
Oct 29, 2003
Sold by
Wells Fargo
Bought by
Ben Curlin
Purchase Details
Closed on
Sep 30, 2003
Sold by
Priority Trustee Sub Tr
Bought by
Wells Fargo Bank Minnesota
Purchase Details
Closed on
Mar 23, 2001
Sold by
Diane Wright
Bought by
Laura Rogers
Purchase Details
Closed on
Dec 11, 2000
Sold by
Cuomo Andrew M Sec Hud
Bought by
Diane Wright
Purchase Details
Closed on
Jan 5, 1999
Sold by
Blakely Tommy V
Bought by
Garrard John V and Garrard Anne H
Purchase Details
Closed on
Aug 5, 1994
Sold by
Philip Sadler
Bought by
Tommy Blakely
Purchase Details
Closed on
Jul 31, 1990
Bought by
Sadler Philip K
Purchase Details
Closed on
Feb 20, 1979
Bought by
Baker Charles H
Purchase Details
Closed on
Nov 3, 1978
Create a Home Valuation Report for This Property
The Home Valuation Report is an in-depth analysis detailing your home's value as well as a comparison with similar homes in the area
Home Values in the Area
Average Home Value in this Area
Purchase History
| Date | Buyer | Sale Price | Title Company |
|---|---|---|---|
| Mitchell Larry Rosko | $27,500 | None Available | |
| Home Buyers Inc | $33,750 | -- | |
| Ben Curlin | $25,000 | -- | |
| Wells Fargo Bank Minnesota | $29,750 | -- | |
| Laura Rogers | $42,500 | -- | |
| Diane Wright | $29,900 | -- | |
| Garrard John V | $190,000 | -- | |
| Tommy Blakely | -- | -- | |
| Sadler Philip K | -- | -- | |
| Baker Charles H | -- | -- | |
| -- | -- | -- |
Source: Public Records
Tax History Compared to Growth
Tax History
| Year | Tax Paid | Tax Assessment Tax Assessment Total Assessment is a certain percentage of the fair market value that is determined by local assessors to be the total taxable value of land and additions on the property. | Land | Improvement |
|---|---|---|---|---|
| 2024 | $148 | $7,900 | $1,200 | $6,700 |
| 2022 | $275 | $7,900 | $1,200 | $6,700 |
| 2021 | $286 | $6,625 | $1,075 | $5,550 |
| 2020 | $286 | $6,625 | $1,075 | $5,550 |
| 2019 | $286 | $6,625 | $1,075 | $5,550 |
| 2018 | $286 | $6,625 | $1,075 | $5,550 |
| 2017 | $276 | $6,250 | $1,075 | $5,175 |
| 2016 | $257 | $6,250 | $1,075 | $5,175 |
| 2015 | $257 | $6,250 | $1,075 | $5,175 |
| 2014 | $257 | $6,250 | $1,075 | $5,175 |
Source: Public Records
Map
Nearby Homes
- 338 Fairmont Ave
- 324 Fairmont Ave
- 316 Fairmont Ave
- 38 Northwood Ave
- 204 Hardee St
- 124 Muse St
- 119 Fairmont Ave
- 136 Bennett St
- 201 Morningside Dr
- 1072 N Highland Ave Unit 10
- 116 Roland Ave
- 43 Larimer Dr
- 1225 N Highland Ave
- 111 Westwood Ave
- 929 N Highland Ave
- 915 N Highland Ave
- 907 N Highland Ave
- 119 Otis St
- 206 Carter St
- 133 Division Ave