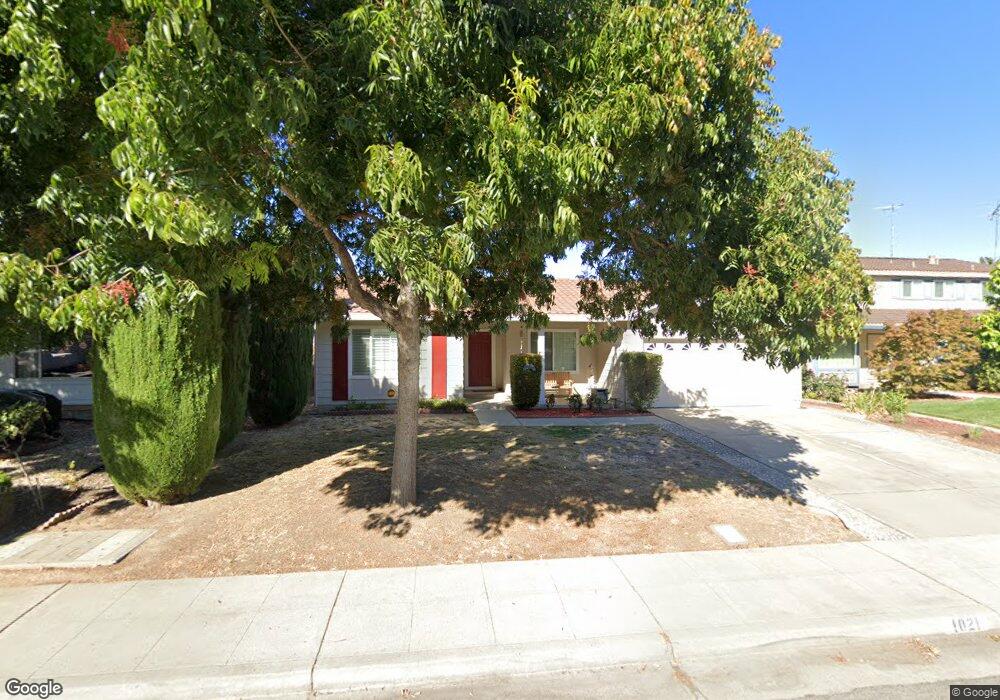
1021 Nandina Way Sunnyvale, CA 94086
Ponderosa Park NeighborhoodEstimated Value: $1,972,000 - $2,852,000
4
Beds
2
Baths
1,691
Sq Ft
$1,517/Sq Ft
Est. Value
About This Home
This home is located at 1021 Nandina Way, Sunnyvale, CA 94086 and is currently estimated at $2,565,586, approximately $1,517 per square foot. 1021 Nandina Way is a home located in Santa Clara County with nearby schools including Ponderosa Elementary School, Marian A. Peterson Middle School, and Adrian Wilcox High School.
Ownership History
Date
Name
Owned For
Owner Type
Purchase Details
Closed on
Sep 28, 2019
Sold by
Carino Christopher Grospe
Bought by
Lu Carino Jo Ann Yao Ting
Current Estimated Value
Purchase Details
Closed on
Nov 17, 2012
Sold by
Lu Carino Jo Ann Yao Ting and Lu Jennifer
Bought by
Lu Carino Jo Ann Yao Ting and Carino Christopher Grospe
Purchase Details
Closed on
Jul 6, 2004
Sold by
Chiu Ing Tsau and Lin Shih Yu
Bought by
Lu Jo Ann and Lu Jennifer
Purchase Details
Closed on
May 20, 1998
Sold by
Chenwei Chiu and Chenwei Caroline T
Bought by
Chiu Ing Tsau and Lin Shih Yu
Home Financials for this Owner
Home Financials are based on the most recent Mortgage that was taken out on this home.
Original Mortgage
$300,000
Interest Rate
5%
Create a Home Valuation Report for This Property
The Home Valuation Report is an in-depth analysis detailing your home's value as well as a comparison with similar homes in the area
Home Values in the Area
Average Home Value in this Area
Purchase History
| Date | Buyer | Sale Price | Title Company |
|---|---|---|---|
| Lu Carino Jo Ann Yao Ting | -- | None Available | |
| Lu Carino Jo Ann Yao Ting | -- | None Available | |
| Lu Jo Ann | $760,000 | Chicago Title | |
| Chiu Ing Tsau | $134,000 | Chicago Title Co |
Source: Public Records
Mortgage History
| Date | Status | Borrower | Loan Amount |
|---|---|---|---|
| Previous Owner | Chiu Ing Tsau | $300,000 |
Source: Public Records
Tax History Compared to Growth
Tax History
| Year | Tax Paid | Tax Assessment Tax Assessment Total Assessment is a certain percentage of the fair market value that is determined by local assessors to be the total taxable value of land and additions on the property. | Land | Improvement |
|---|---|---|---|---|
| 2025 | $12,170 | $1,065,338 | $850,441 | $214,897 |
| 2024 | $12,170 | $1,044,450 | $833,766 | $210,684 |
| 2023 | $12,045 | $1,023,971 | $817,418 | $206,553 |
| 2022 | $11,841 | $1,003,894 | $801,391 | $202,503 |
| 2021 | $11,795 | $984,211 | $785,678 | $198,533 |
| 2020 | $11,580 | $974,120 | $777,622 | $196,498 |
| 2019 | $11,649 | $955,021 | $762,375 | $192,646 |
| 2018 | $10,899 | $936,296 | $747,427 | $188,869 |
| 2017 | $10,838 | $917,938 | $732,772 | $185,166 |
| 2016 | $10,593 | $899,940 | $718,404 | $181,536 |
| 2015 | $10,554 | $886,423 | $707,613 | $178,810 |
| 2014 | $10,049 | $869,060 | $693,752 | $175,308 |
Source: Public Records
Map
Nearby Homes
- 998 Rosa Ct
- 922 Iris Ave
- 3725 Terstena Place Unit 140
- 3715 Terstena Place Unit 202
- 3705 Terstena Place Unit 201
- 1201 Sycamore Terrace Unit 148
- 929 E El Camino Real Unit 320E
- 959 Reed Ave
- 1750 Halford Ave Unit 101
- 1061 Azalea Dr
- Rey Plan at 3131 Camino
- Asis Plan at 3131 Camino
- Soledad Plan at 3131 Camino
- Arya Plan at 3131 Camino
- Sarria Plan at 3131 Camino
- Zara Plan at 3131 Camino
- Issa Plan at 3131 Camino
- Lila Plan at 3131 Camino
- 474 Sequoia Dr
- 1007 Bryant Way Unit B
- 1025 Nandina Way
- 1017 Nandina Way
- 1020 Lupine Dr
- 1024 Lupine Dr
- 1016 Lupine Dr
- 1029 Nandina Way
- 1015 Nandina Way
- 1018 Nandina Way
- 1020 Nandina Way
- 1028 Lupine Dr
- 1014 Lupine Dr
- 1016 Nandina Way
- 1033 Nandina Way
- 1013 Nandina Way
- 1024 Nandina Way
- 1014 Nandina Way
- 1032 Lupine Dr
- 1012 Lupine Dr
- 1028 Nandina Way
- 871 Poppy Ct