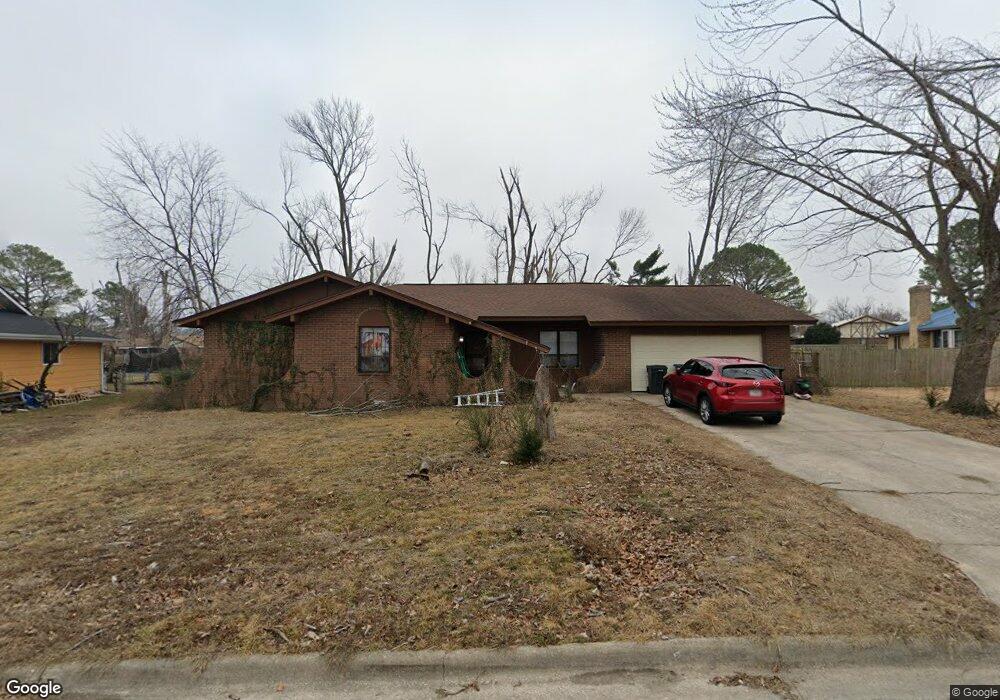
1021 S 22nd Cir Rogers, AR 72758
Estimated Value: $345,000 - $407,000
--
Bed
3
Baths
2,150
Sq Ft
$174/Sq Ft
Est. Value
About This Home
This home is located at 1021 S 22nd Cir, Rogers, AR 72758 and is currently estimated at $374,181, approximately $174 per square foot. 1021 S 22nd Cir is a home located in Benton County with nearby schools including Westside Elementary School, Oakdale Middle School, and Rogers Heritage High School.
Ownership History
Date
Name
Owned For
Owner Type
Purchase Details
Closed on
Nov 3, 2008
Sold by
Hsbc Mortgage Services Inc
Bought by
Gabbard Justin
Current Estimated Value
Home Financials for this Owner
Home Financials are based on the most recent Mortgage that was taken out on this home.
Original Mortgage
$103,377
Outstanding Balance
$67,275
Interest Rate
5.99%
Mortgage Type
FHA
Estimated Equity
$306,906
Purchase Details
Closed on
Mar 10, 2008
Sold by
Daniels Michael and Daniels Susan
Bought by
Hsbc Mortgage Services Inc
Purchase Details
Closed on
Aug 3, 2004
Bought by
Daniels
Purchase Details
Closed on
Jul 22, 2004
Bought by
Daniels
Purchase Details
Closed on
Oct 9, 1992
Bought by
Guthrie
Purchase Details
Closed on
Feb 26, 1992
Bought by
Dod 02-26-1992
Purchase Details
Closed on
Mar 17, 1985
Bought by
Dod 03-17-1985
Purchase Details
Closed on
Jul 9, 1974
Bought by
Fisher
Create a Home Valuation Report for This Property
The Home Valuation Report is an in-depth analysis detailing your home's value as well as a comparison with similar homes in the area
Home Values in the Area
Average Home Value in this Area
Purchase History
| Date | Buyer | Sale Price | Title Company |
|---|---|---|---|
| Gabbard Justin | $105,000 | None Available | |
| Hsbc Mortgage Services Inc | $100,506 | None Available | |
| Daniels | $135,000 | -- | |
| Daniels | $135,000 | -- | |
| Guthrie | $75,000 | -- | |
| Dod 02-26-1992 | -- | -- | |
| Dod 03-17-1985 | -- | -- | |
| Fisher | $40,000 | -- |
Source: Public Records
Mortgage History
| Date | Status | Borrower | Loan Amount |
|---|---|---|---|
| Open | Gabbard Justin | $103,377 |
Source: Public Records
Tax History Compared to Growth
Tax History
| Year | Tax Paid | Tax Assessment Tax Assessment Total Assessment is a certain percentage of the fair market value that is determined by local assessors to be the total taxable value of land and additions on the property. | Land | Improvement |
|---|---|---|---|---|
| 2025 | $2,006 | $62,045 | $19,000 | $43,045 |
| 2024 | $1,868 | $62,045 | $19,000 | $43,045 |
| 2023 | $1,780 | $41,740 | $8,000 | $33,740 |
| 2022 | $1,395 | $41,740 | $8,000 | $33,740 |
| 2021 | $1,310 | $41,740 | $8,000 | $33,740 |
| 2020 | $1,231 | $29,260 | $4,600 | $24,660 |
| 2019 | $1,231 | $29,260 | $4,600 | $24,660 |
| 2018 | $1,256 | $29,260 | $4,600 | $24,660 |
| 2017 | $1,073 | $29,260 | $4,600 | $24,660 |
| 2016 | $1,073 | $29,260 | $4,600 | $24,660 |
| 2015 | $1,381 | $26,110 | $5,000 | $21,110 |
| 2014 | $1,031 | $26,110 | $5,000 | $21,110 |
Source: Public Records
Map
Nearby Homes
- 1012 S 19th St
- 1905 W Countryside Ln
- 1903 Countryside Ln
- 1611 S Beth Dr
- 1600 S 23rd Place
- 1701 Beth Dr
- 1602 S 23rd Place
- 2327 W Seminole Dr
- 2331 W Seminole Dr
- 2333 W Seminole Dr
- 2104 W Oak St
- 2308 W Willow St
- 2202 W Oak St
- 2432 & 2434 W Magnolia St
- 1811 S 22nd St
- 1704 S Dixieland Rd
- 916 S 25th Place
- 2001 & 2003 W Sycamore St
- 902 S 17th St
- 917 S 15th St