Estimated Value: $633,000 - $711,000
4
Beds
2
Baths
1,272
Sq Ft
$531/Sq Ft
Est. Value
About This Home
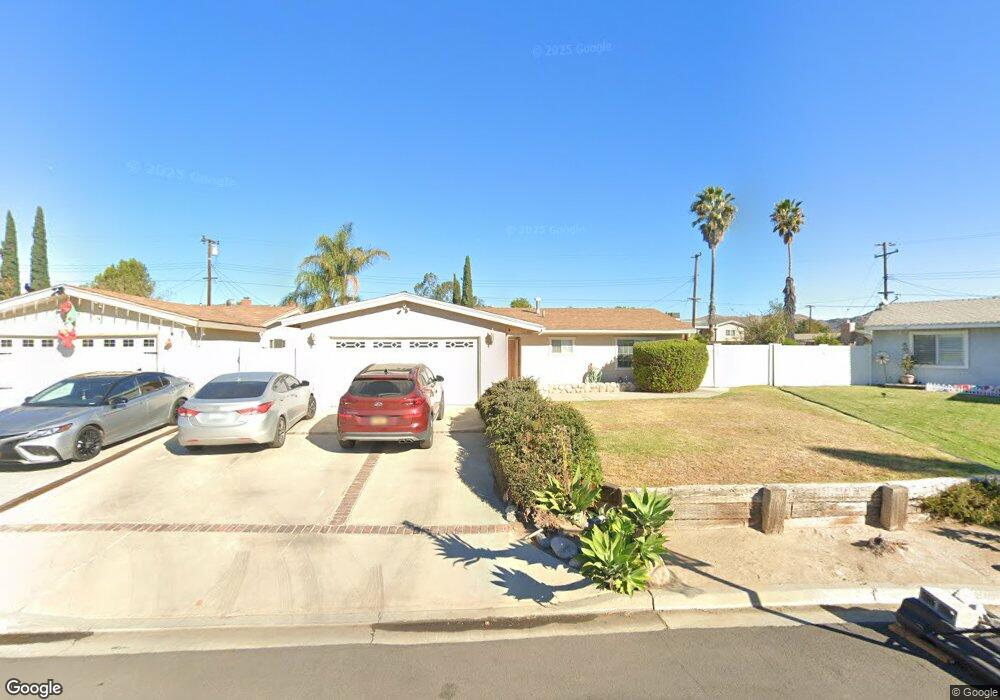
This home is located at 1021 Staynor Way, Norco, CA 92860 and is currently estimated at $675,017, approximately $530 per square foot. 1021 Staynor Way is a home located in Riverside County with nearby schools including Norco Elementary, Norco Intermediate School, and Norco High School.
Ownership History
Date
Name
Owned For
Owner Type
Purchase Details
Closed on
Jan 24, 2017
Sold by
Revollo Ulda
Bought by
Revollo Ulda and Family Trust Of Ulda Revollo
Current Estimated Value
Purchase Details
Closed on
Jun 16, 2016
Sold by
Revollo Ulda
Bought by
Revollo Ulda and The Revollo Family Trust
Home Financials for this Owner
Home Financials are based on the most recent Mortgage that was taken out on this home.
Original Mortgage
$180,000
Interest Rate
3.64%
Mortgage Type
New Conventional
Purchase Details
Closed on
Sep 17, 2010
Sold by
Revollo Ulda
Bought by
Revollo Ulda and The Revollo Family Trust
Home Financials for this Owner
Home Financials are based on the most recent Mortgage that was taken out on this home.
Original Mortgage
$145,000
Interest Rate
4.28%
Mortgage Type
New Conventional
Purchase Details
Closed on
Jan 14, 2002
Sold by
Revollo Julio and Revollo Ulda
Bought by
Revollo Julio and Revollo Ulda
Create a Home Valuation Report for This Property
The Home Valuation Report is an in-depth analysis detailing your home's value as well as a comparison with similar homes in the area
Home Values in the Area
Average Home Value in this Area
Purchase History
| Date | Buyer | Sale Price | Title Company |
|---|---|---|---|
| Revollo Ulda | -- | None Available | |
| Revollo Ulda | -- | First American Title Ins Co | |
| Revollo Ulda | -- | Nations Title Company | |
| Revollo Ulda | -- | Nations Title Company | |
| Revollo Julio | -- | -- |
Source: Public Records
Mortgage History
| Date | Status | Borrower | Loan Amount |
|---|---|---|---|
| Closed | Revollo Ulda | $180,000 | |
| Closed | Revollo Ulda | $145,000 |
Source: Public Records
Tax History Compared to Growth
Tax History
| Year | Tax Paid | Tax Assessment Tax Assessment Total Assessment is a certain percentage of the fair market value that is determined by local assessors to be the total taxable value of land and additions on the property. | Land | Improvement |
|---|---|---|---|---|
| 2025 | $2,706 | $246,481 | $82,766 | $163,715 |
| 2023 | $2,706 | $236,911 | $79,553 | $157,358 |
| 2022 | $2,620 | $232,267 | $77,994 | $154,273 |
| 2021 | $2,567 | $227,714 | $76,465 | $151,249 |
| 2020 | $2,539 | $225,380 | $75,681 | $149,699 |
| 2019 | $2,480 | $220,962 | $74,198 | $146,764 |
| 2018 | $2,423 | $216,631 | $72,744 | $143,887 |
| 2017 | $2,363 | $212,384 | $71,318 | $141,066 |
| 2016 | $2,339 | $208,220 | $69,920 | $138,300 |
| 2015 | $2,287 | $205,095 | $68,871 | $136,224 |
| 2014 | $2,203 | $201,079 | $67,523 | $133,556 |
Source: Public Records
Map
Nearby Homes
- 2597 Corona Ave
- 2703 Reservoir Dr
- 2582 Reservoir Dr
- 887 Kingman Dr
- 2830 Valley View Ave
- 2627 Valley View Ave
- 970 3rd St
- 2633 Valley View Ave
- 1366 Arroyo Ln
- 3134 Half Circle Rd
- 770 3rd St
- 3202 Half Circle Rd
- 1531 Elm Dr
- 2655 Hamner Ave
- 1049 2nd St
- 1825 Tonto Bar Ln
- 0 California Ave
- 3475 Hillside Ave
- 0 6th & Corona Unit SW25164144
- 3480 Hamner Ave
- 1031 Staynor Way
- 1011 Staynor Way
- 1030 Curtis Dr
- 1040 Curtis Dr
- 1041 Staynor Way
- 1000 Staynor Way
- 1020 Curtis Dr
- 1050 Curtis Dr
- 2670 Temescal Ave
- 2650 Temescal Ave
- 1051 Staynor Way
- 2686 Temescal Ave
- 1030 Staynor Way
- 2636 Temescal Ave
- 1010 Staynor Way
- 1040 Staynor Way
- 2696 Temescal Ave
- 2743 Ridgecrest Ave
- 2622 Temescal Ave
- 1020 Staynor Way