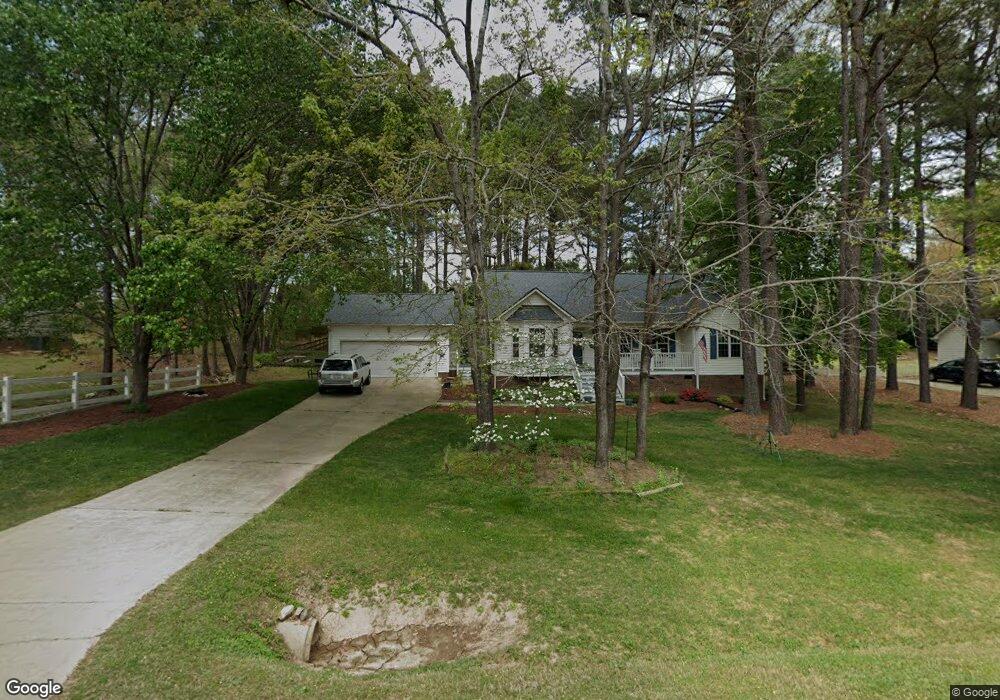
1021 Stonewater Dr Raleigh, NC 27603
Estimated Value: $367,000 - $384,810
3
Beds
2
Baths
1,672
Sq Ft
$225/Sq Ft
Est. Value
About This Home
This home is located at 1021 Stonewater Dr, Raleigh, NC 27603 and is currently estimated at $376,453, approximately $225 per square foot. 1021 Stonewater Dr is a home located in Wake County with nearby schools including North Garner Middle and Garner High.
Ownership History
Date
Name
Owned For
Owner Type
Purchase Details
Closed on
Nov 18, 2009
Sold by
Winchester Albert D and Winchester Susan F
Bought by
Osborne Domenic and Osborne Louise D
Current Estimated Value
Purchase Details
Closed on
Mar 31, 2008
Sold by
Winchester Albert D and Winchester Susan F
Bought by
Winchester Albert D and Winchester Susan F
Home Financials for this Owner
Home Financials are based on the most recent Mortgage that was taken out on this home.
Original Mortgage
$159,000
Interest Rate
6.08%
Mortgage Type
New Conventional
Purchase Details
Closed on
Mar 19, 1999
Sold by
Windsor Construction Co Inc
Bought by
Winchester Albert D
Home Financials for this Owner
Home Financials are based on the most recent Mortgage that was taken out on this home.
Original Mortgage
$148,423
Interest Rate
6.74%
Mortgage Type
VA
Purchase Details
Closed on
Sep 2, 1998
Sold by
Son Lan Fairway Development Co Inc
Bought by
Windsor Construction Co Inc
Create a Home Valuation Report for This Property
The Home Valuation Report is an in-depth analysis detailing your home's value as well as a comparison with similar homes in the area
Home Values in the Area
Average Home Value in this Area
Purchase History
| Date | Buyer | Sale Price | Title Company |
|---|---|---|---|
| Osborne Domenic | $180,000 | None Available | |
| Winchester Albert D | -- | Lsi | |
| Winchester Albert D | $144,500 | -- | |
| Windsor Construction Co Inc | $51,500 | -- |
Source: Public Records
Mortgage History
| Date | Status | Borrower | Loan Amount |
|---|---|---|---|
| Previous Owner | Winchester Albert D | $159,000 | |
| Previous Owner | Winchester Albert D | $148,423 |
Source: Public Records
Tax History Compared to Growth
Tax History
| Year | Tax Paid | Tax Assessment Tax Assessment Total Assessment is a certain percentage of the fair market value that is determined by local assessors to be the total taxable value of land and additions on the property. | Land | Improvement |
|---|---|---|---|---|
| 2025 | $2,340 | $362,770 | $80,000 | $282,770 |
| 2024 | $2,273 | $362,770 | $80,000 | $282,770 |
| 2023 | $1,924 | $244,164 | $46,000 | $198,164 |
| 2022 | $1,783 | $244,164 | $46,000 | $198,164 |
| 2021 | $1,536 | $244,164 | $46,000 | $198,164 |
| 2020 | $1,707 | $244,164 | $46,000 | $198,164 |
| 2019 | $1,537 | $185,759 | $42,000 | $143,759 |
| 2018 | $1,414 | $185,759 | $42,000 | $143,759 |
| 2017 | $1,341 | $185,759 | $42,000 | $143,759 |
| 2016 | $700 | $185,759 | $42,000 | $143,759 |
| 2015 | $1,050 | $189,231 | $44,000 | $145,231 |
| 2014 | $1,100 | $189,231 | $44,000 | $145,231 |
Source: Public Records
Map
Nearby Homes
- 272 Travel Lite Dr
- 120 Line Dr
- 408 Johnston Rd
- 392 Travel Lite Dr
- 6408 Glen Brack Ct
- 170 Sallyport Ct
- 6908 Longridge Dr
- 221 Old Hickory Dr
- 1153 Polo Dr
- 595 Durwood Dr
- 618 Durwood Dr
- 6257 Oak Passage Dr
- 6313 Southern Charm Ln
- 4212 Rockside Hills Dr
- 48 Banbury Ct
- 6121 Catandpolly Ln
- 1004 Snow Peak Ct
- 212 Fox Pen Dr
- 6009 Swales Way
- 7508 Frasier Fir Place
- 1025 Stonewater Dr
- 1017 Stonewater Dr
- LOT 69 Stonewater Dr
- 6708 Oviedo Dr
- 1013 Stonewater Dr
- 6125 Oviedo Dr
- 7016 Field Hill Rd
- 6701 Oviedo Dr
- 1016 Stonewater Dr
- 6712 Oviedo Dr
- 1009 Stonewater Dr
- 1100 Stonewater Dr
- 1012 Stonewater Dr
- 7015 Field Hill Rd
- 6656 Saint Jens Ln
- 1105 Stonewater Dr
- 7012 Field Hill Rd
- 6720 Oviedo Dr
- 1005 Stonewater Dr
- 1104 Stonewater Dr