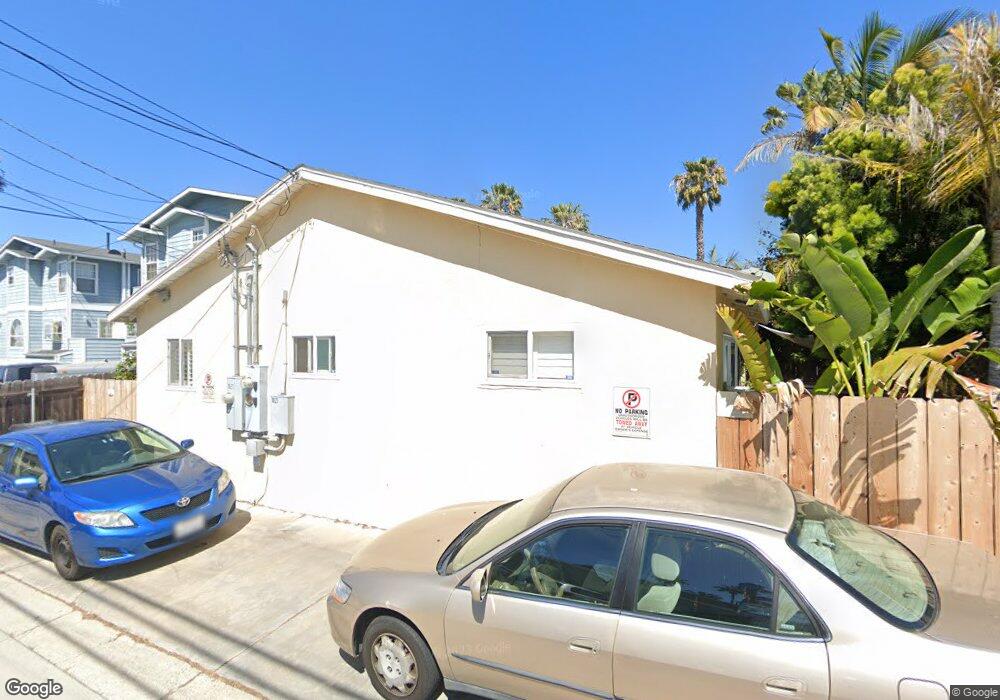
1021 Tourmaline St Unit U2 San Diego, CA 92109
Pacific Beach NeighborhoodEstimated Value: $1,157,000 - $1,309,000
4
Beds
2
Baths
1,232
Sq Ft
$993/Sq Ft
Est. Value
About This Home
This home is located at 1021 Tourmaline St Unit U2, San Diego, CA 92109 and is currently estimated at $1,222,971, approximately $992 per square foot. 1021 Tourmaline St Unit U2 is a home located in San Diego County with nearby schools including Pacific Beach Elementary School, Pacific Beach Middle, and Mission Bay High School.
Ownership History
Date
Name
Owned For
Owner Type
Purchase Details
Closed on
Jun 9, 2021
Sold by
Ferns Barry W and Ferns Laurel A
Bought by
Velasquez Kelly Colleen
Current Estimated Value
Purchase Details
Closed on
Jul 19, 2006
Sold by
Kaprow Marisa T
Bought by
Ferns Barry W and Ferns Laurel A
Home Financials for this Owner
Home Financials are based on the most recent Mortgage that was taken out on this home.
Original Mortgage
$400,000
Interest Rate
6.76%
Mortgage Type
Stand Alone First
Purchase Details
Closed on
May 25, 2000
Sold by
Regency Partners Iii Llc
Bought by
Kaprow Marisa T
Home Financials for this Owner
Home Financials are based on the most recent Mortgage that was taken out on this home.
Original Mortgage
$255,200
Interest Rate
7.93%
Create a Home Valuation Report for This Property
The Home Valuation Report is an in-depth analysis detailing your home's value as well as a comparison with similar homes in the area
Home Values in the Area
Average Home Value in this Area
Purchase History
| Date | Buyer | Sale Price | Title Company |
|---|---|---|---|
| Velasquez Kelly Colleen | -- | None Available | |
| Ferns Barry W | $660,000 | California Title Company | |
| Kaprow Marisa T | $319,000 | Chicago Title |
Source: Public Records
Mortgage History
| Date | Status | Borrower | Loan Amount |
|---|---|---|---|
| Previous Owner | Ferns Barry W | $400,000 | |
| Previous Owner | Kaprow Marisa T | $255,200 |
Source: Public Records
Tax History Compared to Growth
Tax History
| Year | Tax Paid | Tax Assessment Tax Assessment Total Assessment is a certain percentage of the fair market value that is determined by local assessors to be the total taxable value of land and additions on the property. | Land | Improvement |
|---|---|---|---|---|
| 2025 | $13,361 | $1,114,268 | $955,087 | $159,181 |
| 2024 | $13,361 | $1,092,420 | $936,360 | $156,060 |
| 2023 | $13,152 | $1,071,000 | $918,000 | $153,000 |
| 2022 | $12,802 | $1,050,000 | $900,000 | $150,000 |
| 2021 | $9,087 | $735,000 | $553,000 | $182,000 |
| 2020 | $8,639 | $700,000 | $527,000 | $173,000 |
| 2019 | $8,654 | $700,000 | $527,000 | $173,000 |
| 2018 | $8,252 | $700,000 | $527,000 | $173,000 |
| 2017 | $80 | $650,000 | $490,000 | $160,000 |
| 2016 | $7,661 | $650,000 | $490,000 | $160,000 |
| 2015 | $7,663 | $650,000 | $490,000 | $160,000 |
| 2014 | $7,103 | $600,000 | $453,000 | $147,000 |
Source: Public Records
Map
Nearby Homes
- 972 Sapphire St Unit LA1
- 974 Sapphire St Unit LA2
- 976 Sapphire St Unit LA3
- 938 Opal St
- 1154 Sapphire St
- 1059 Agate St Unit A
- 1148 Turquoise St
- 1025 Wilbur Ave
- 4944 Cass St Unit 604
- 4944 Cass St Unit 407
- 1045 Van Nuys St
- 5209 Foothill Blvd
- 751-63 Turquoise St Unit 27-30
- 819 Van Nuys St
- 5452 Moonlight Ln
- 5416 Candlelight Dr
- 1326 Caminito Arriata
- 1329 Caminito Balada
- 1505 Loring St
- 4767 Ocean Blvd
- 1019 Tourmaline St Unit U1
- 1009 Tourmaline St Unit 4
- 1009 Tourmaline St Unit 3
- 1009 Tourmaline St Unit 2
- 1009 Tourmaline St Unit 1
- 1027 Tourmaline St Unit D
- 1027 Tourmaline St Unit C
- 1027 Tourmaline St Unit B
- 1027 Tourmaline St Unit A
- 5063 Cass St
- 1005 Tourmaline St Unit 4
- 1005 Tourmaline St Unit 3
- 1005 Tourmaline St Unit 2
- 1005 Tourmaline St Unit 1
- 1028 Opal St Unit 30
- 1035 Tourmaline St Unit 37
- 1020 Opal St
- 1036 Opal St Unit 38
- 1047 Tourmaline St
- 1014 Tourmaline St