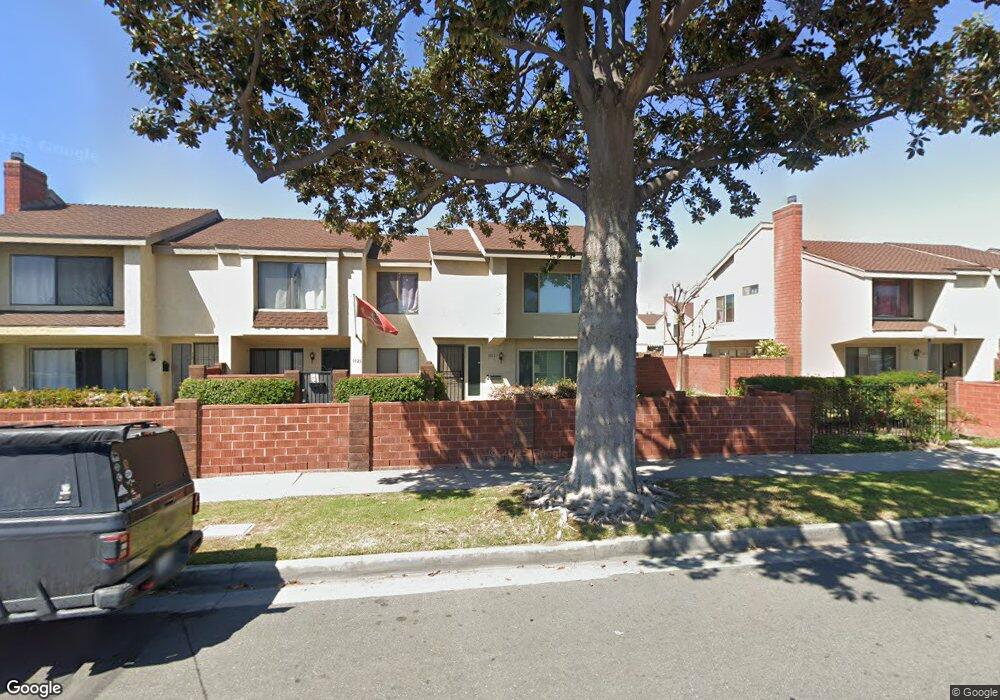
1021 W Orangewood Ave Anaheim, CA 92802
The Anaheim Resort NeighborhoodEstimated Value: $714,864 - $786,000
3
Beds
3
Baths
1,333
Sq Ft
$561/Sq Ft
Est. Value
About This Home
This home is located at 1021 W Orangewood Ave, Anaheim, CA 92802 and is currently estimated at $747,466, approximately $560 per square foot. 1021 W Orangewood Ave is a home located in Orange County with nearby schools including Alexander J. Stoddard Elementary School, Ball Junior High School, and Loara High School.
Ownership History
Date
Name
Owned For
Owner Type
Purchase Details
Closed on
Nov 28, 2018
Sold by
Medlock Clarisa D
Bought by
Declaration Medlock Clarisa D and Clarisa D Medlock Declaration Of Trust
Current Estimated Value
Purchase Details
Closed on
Mar 8, 2011
Sold by
Winship Michael L
Bought by
Medlock Clarisa D
Home Financials for this Owner
Home Financials are based on the most recent Mortgage that was taken out on this home.
Original Mortgage
$180,895
Outstanding Balance
$124,760
Interest Rate
4.87%
Mortgage Type
FHA
Estimated Equity
$622,706
Purchase Details
Closed on
Jun 9, 1997
Sold by
Galindo Luis C and Galindo Rosaline Rosaline
Bought by
Winship Michael L
Home Financials for this Owner
Home Financials are based on the most recent Mortgage that was taken out on this home.
Original Mortgage
$116,755
Interest Rate
7.91%
Create a Home Valuation Report for This Property
The Home Valuation Report is an in-depth analysis detailing your home's value as well as a comparison with similar homes in the area
Home Values in the Area
Average Home Value in this Area
Purchase History
| Date | Buyer | Sale Price | Title Company |
|---|---|---|---|
| Declaration Medlock Clarisa D | -- | None Available | |
| Medlock Clarisa D | $187,000 | Lsi Title Company | |
| Winship Michael L | $123,000 | Stewart Title |
Source: Public Records
Mortgage History
| Date | Status | Borrower | Loan Amount |
|---|---|---|---|
| Open | Medlock Clarisa D | $180,895 | |
| Previous Owner | Winship Michael L | $116,755 |
Source: Public Records
Tax History Compared to Growth
Tax History
| Year | Tax Paid | Tax Assessment Tax Assessment Total Assessment is a certain percentage of the fair market value that is determined by local assessors to be the total taxable value of land and additions on the property. | Land | Improvement |
|---|---|---|---|---|
| 2025 | $3,903 | $333,101 | $223,638 | $109,463 |
| 2024 | $3,903 | $326,570 | $219,253 | $107,317 |
| 2023 | $3,818 | $320,167 | $214,954 | $105,213 |
| 2022 | $3,766 | $313,890 | $210,740 | $103,150 |
| 2021 | $3,770 | $307,736 | $206,608 | $101,128 |
| 2020 | $3,753 | $304,581 | $204,489 | $100,092 |
| 2019 | $3,643 | $298,609 | $200,479 | $98,130 |
| 2018 | $3,567 | $292,754 | $196,548 | $96,206 |
| 2017 | $3,428 | $287,014 | $192,694 | $94,320 |
| 2016 | $3,416 | $281,387 | $188,916 | $92,471 |
| 2015 | $3,384 | $277,161 | $186,079 | $91,082 |
| 2014 | $3,178 | $271,732 | $182,434 | $89,298 |
Source: Public Records
Map
Nearby Homes
- 11531 West St
- 11402 Morgan Ln
- 11531 Kathy Ln
- 11401 Kathy Ln
- 827 W Orangewood Ave
- 11341 Jacalene Ln
- 1913 S Norma Ln
- 11552 9th St
- 11731 Rose Dr
- 405 13181 Lampson
- 2134 S Acama St
- 2115 1/2 S Broden St
- 2115 S Broden St
- 2154 S Madrid St
- 1828 S Ninth St
- 2227 S Atlanta St
- 335 W Summerfield Cir Unit 6
- 423 W Summerfield Cir Unit 87
- 12246 Nadine Cir
- 11841 Shetland Rd
- 1023 W Orangewood Ave
- 1025 W Orangewood Ave
- 1015 W Orangewood Ave
- 1013 W Orangewood Ave
- 1024 W Lamark Ln
- 1020 W Lamark Ln
- 1031 W Orangewood Ave
- 1028 W Lamark Ln
- 1011 W Orangewood Ave
- 1033 W Orangewood Ave
- 1032 W Lamark Ln
- 976 W Lamark Ln
- 1036 W Lamark Ln
- 1016 W Lamark Ln
- 1035 W Orangewood Ave
- 1005 W Orangewood Ave
- 974 W Lamark Ln
- 1040 W Lamark Ln
- 1012 W Lamark Ln
- 972 W Lamark Ln