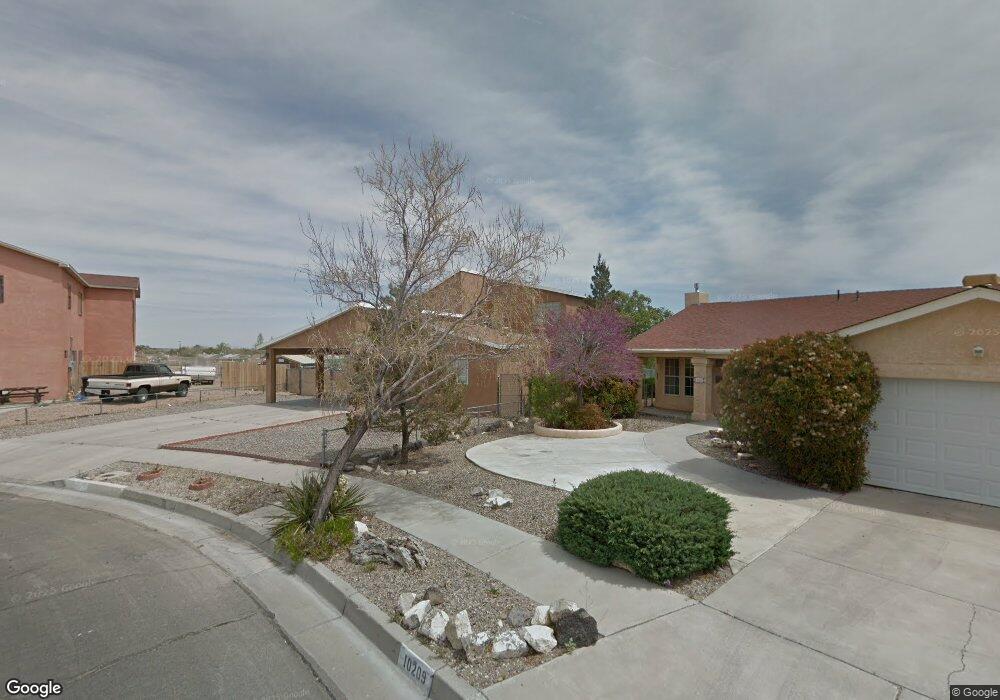
10213 Guadiana Place SW Unit JT Albuquerque, NM 87121
Southwest Heights NeighborhoodEstimated Value: $257,000 - $338,000
3
Beds
2
Baths
1,845
Sq Ft
$160/Sq Ft
Est. Value
About This Home
This home is located at 10213 Guadiana Place SW Unit JT, Albuquerque, NM 87121 and is currently estimated at $295,188, approximately $159 per square foot. 10213 Guadiana Place SW Unit JT is a home located in Bernalillo County with nearby schools including Carlos Rey Elementary School, Tony Hillerman Middle School, and Atrisco Heritage Academy High School.
Ownership History
Date
Name
Owned For
Owner Type
Purchase Details
Closed on
Oct 14, 2011
Sold by
Deutsche Bank National Trust Company
Bought by
Crow Tania M
Current Estimated Value
Home Financials for this Owner
Home Financials are based on the most recent Mortgage that was taken out on this home.
Original Mortgage
$110,010
Outstanding Balance
$74,901
Interest Rate
4.14%
Mortgage Type
FHA
Estimated Equity
$220,287
Purchase Details
Closed on
Feb 11, 2011
Sold by
Baca Debra
Bought by
Deutsche Bank National Trust Company
Purchase Details
Closed on
Jun 30, 2006
Sold by
Quezada David Anthony and Quezada Celina Gabaldon
Bought by
Baca Debra and Armijo Priscilla
Home Financials for this Owner
Home Financials are based on the most recent Mortgage that was taken out on this home.
Original Mortgage
$125,000
Interest Rate
10.15%
Mortgage Type
Balloon
Create a Home Valuation Report for This Property
The Home Valuation Report is an in-depth analysis detailing your home's value as well as a comparison with similar homes in the area
Home Values in the Area
Average Home Value in this Area
Purchase History
| Date | Buyer | Sale Price | Title Company |
|---|---|---|---|
| Crow Tania M | -- | American Southwest Title Llc | |
| Deutsche Bank National Trust Company | $106,250 | None Available | |
| Baca Debra | -- | Fidelity Natl Title Ins Co |
Source: Public Records
Mortgage History
| Date | Status | Borrower | Loan Amount |
|---|---|---|---|
| Open | Crow Tania M | $110,010 | |
| Previous Owner | Baca Debra | $125,000 |
Source: Public Records
Tax History Compared to Growth
Tax History
| Year | Tax Paid | Tax Assessment Tax Assessment Total Assessment is a certain percentage of the fair market value that is determined by local assessors to be the total taxable value of land and additions on the property. | Land | Improvement |
|---|---|---|---|---|
| 2025 | $1,759 | $45,014 | $9,405 | $35,609 |
| 2024 | $1,759 | $43,703 | $9,131 | $34,572 |
| 2023 | $1,728 | $42,430 | $8,865 | $33,565 |
| 2022 | $1,667 | $41,194 | $8,607 | $32,587 |
| 2021 | $1,609 | $39,996 | $8,357 | $31,639 |
| 2020 | $1,580 | $38,831 | $8,114 | $30,717 |
| 2019 | $1,531 | $37,700 | $7,877 | $29,823 |
| 2018 | $1,474 | $37,700 | $7,877 | $29,823 |
| 2017 | $1,426 | $36,602 | $7,648 | $28,954 |
| 2016 | $1,383 | $34,501 | $7,209 | $27,292 |
| 2015 | $33,496 | $33,496 | $6,999 | $26,497 |
| 2014 | $1,337 | $33,496 | $6,999 | $26,497 |
| 2013 | -- | $33,796 | $6,999 | $26,797 |
Source: Public Records
Map
Nearby Homes
- 2105 Hermosa Creek Dr SW
- 10427 Sandy Flats Ave SW
- 2408 Sun Gate Trail SW
- 2401 Ghost Ranch St SW
- 9909 Saddlehorn Trail SW
- 10915 Denton Rd SW
- 1327 Amole Vista St SW
- 10622 Benavides Rd SW
- 2204 San Leon St SW
- 10709 Anaya St SW
- 2627 Sun Canyon Ln SW
- 2615 Silver Star Dr SW
- 10608 Buck Island Rd SW
- 9901 Morning Sun Trail SW
- 1520 Elfego Baca Dr SW Unit 2
- 11024 Bowie Rd SW
- 10519 Valedon Ln SW
- 10319 Cristalino Rd SW
- 9808 Morning Sun Trail SW
- 10512 Valedon Ln SW
- 10209 Guadiana Place SW
- 10217 Guadiana Place SW
- 10205 Guadiana Place SW
- 10300 Guadiana Place SW
- 10301 Guadiana Place SW
- 10201 Guadiana Place SW
- 10304 Guadiana Place SW
- 10305 Guadiana Place SW
- 10301 Cartagena Ave SW
- 10309 Guadiana Place SW
- 10308 Guadiana Place SW
- 10305 Cartagena Ave SW
- 10309 Cartagena Ave SW
- 10200 Cartagena Ave SW
- 10312 Guadiana Place SW
- 10204 Cartagena Ave SW
- 10148 Cartagena Ave SW
- 10313 Guadiana Place SW
- 10304 Cartagena Ave SW
- 10144 Cartagena Ave SW