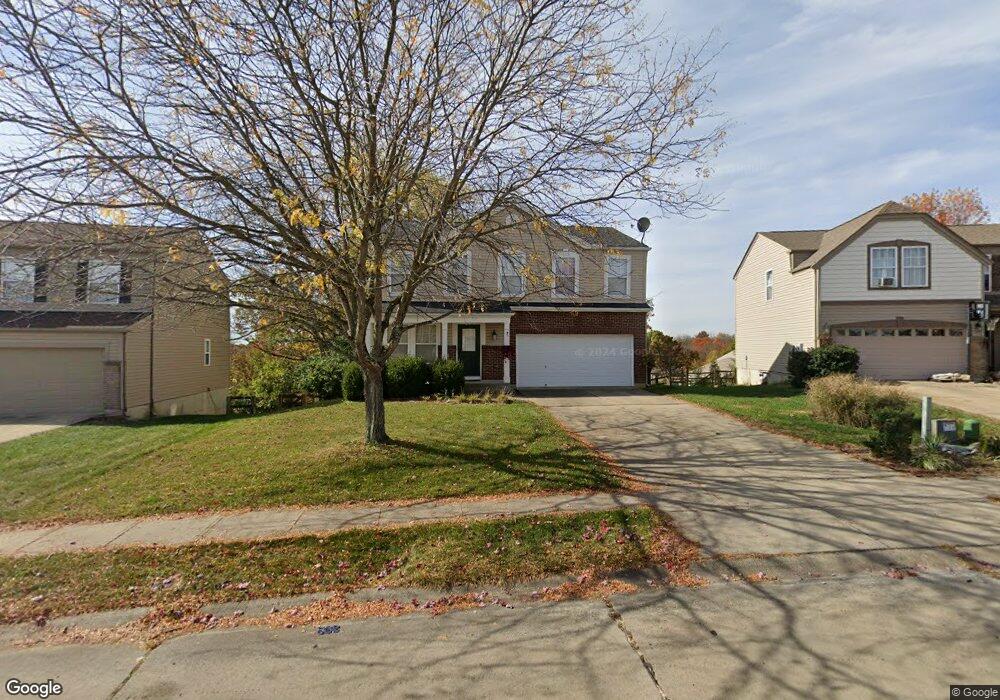
10213 Meadow Glen Dr Independence, KY 41051
Estimated Value: $346,000 - $379,000
4
Beds
3
Baths
1,829
Sq Ft
$196/Sq Ft
Est. Value
About This Home
This home is located at 10213 Meadow Glen Dr, Independence, KY 41051 and is currently estimated at $357,886, approximately $195 per square foot. 10213 Meadow Glen Dr is a home located in Kenton County with nearby schools including Simon Kenton High School, St. Cecilia Catholic School, and Zion Christian Academy.
Ownership History
Date
Name
Owned For
Owner Type
Purchase Details
Closed on
May 31, 2018
Sold by
Aasen James Robert and Aasen Heather
Bought by
Hart Evan P
Current Estimated Value
Home Financials for this Owner
Home Financials are based on the most recent Mortgage that was taken out on this home.
Original Mortgage
$210,101
Outstanding Balance
$181,702
Interest Rate
4.5%
Mortgage Type
New Conventional
Estimated Equity
$176,184
Purchase Details
Closed on
Oct 24, 2006
Sold by
Maple Street Homes Llc
Bought by
Aasen James Robert
Home Financials for this Owner
Home Financials are based on the most recent Mortgage that was taken out on this home.
Original Mortgage
$140,372
Interest Rate
7.65%
Mortgage Type
Stand Alone First
Purchase Details
Closed on
Aug 24, 2006
Sold by
Hasekoester Reese Llc
Bought by
Maple Street Homes Llc
Create a Home Valuation Report for This Property
The Home Valuation Report is an in-depth analysis detailing your home's value as well as a comparison with similar homes in the area
Home Values in the Area
Average Home Value in this Area
Purchase History
| Date | Buyer | Sale Price | Title Company |
|---|---|---|---|
| Hart Evan P | $208,000 | Springdale Title Llc | |
| Aasen James Robert | $175,465 | Homestead Title Agency Ltd | |
| Maple Street Homes Llc | $31,000 | None Available |
Source: Public Records
Mortgage History
| Date | Status | Borrower | Loan Amount |
|---|---|---|---|
| Open | Hart Evan P | $210,101 | |
| Previous Owner | Aasen James Robert | $140,372 |
Source: Public Records
Tax History Compared to Growth
Tax History
| Year | Tax Paid | Tax Assessment Tax Assessment Total Assessment is a certain percentage of the fair market value that is determined by local assessors to be the total taxable value of land and additions on the property. | Land | Improvement |
|---|---|---|---|---|
| 2024 | $2,548 | $208,000 | $48,000 | $160,000 |
| 2023 | $2,625 | $208,000 | $48,000 | $160,000 |
| 2022 | $2,684 | $208,000 | $48,000 | $160,000 |
| 2021 | $2,724 | $208,000 | $48,000 | $160,000 |
| 2020 | $2,781 | $208,000 | $40,000 | $168,000 |
| 2019 | $2,789 | $208,000 | $40,000 | $168,000 |
| 2018 | $2,376 | $175,400 | $40,000 | $135,400 |
| 2017 | $2,311 | $175,400 | $40,000 | $135,400 |
| 2015 | $2,244 | $175,400 | $35,000 | $140,400 |
| 2014 | $2,213 | $175,400 | $35,000 | $140,400 |
Source: Public Records
Map
Nearby Homes
- 1373 Meadowrun Ln
- 1375 Grandarbor Cir
- 1381 Poplartree Place
- 10150 Meadow Glen Dr
- Cumberland Plan at Meadow Glen - Maple Street Collection
- Wesley Plan at Meadow Glen - Maple Street Collection
- 1355 Meadowcrest Cir
- 10323 Manassas Ct
- 9972 Meadow Glen Dr
- 10311 Emancipation Place
- 9947 Meadow Glen Dr
- 10383 Lynchburg Dr
- 10363 Canberra Dr
- 9831 Codyview Dr
- 10434 Sharpsburg Dr
- 1365 Cairns Ct
- 10438 Canberra Dr
- 10448 Canberra Dr
- 570 Old Bristow Rd
- 4102 Willowview Dr
- 10213 Meadow Glen Dr Unit 77
- 10209 Meadow Glen Dr
- 10209 Meadow Glen Dr Unit 100
- 10217 Meadow Glen Dr
- 10205 Meadow Glen Dr
- 10210 Highmeadow Ln
- 10201 Meadow Glen Dr
- 10201 Meadow Glen Dr Unit 102
- 10221 Meadow Glen Dr
- 10206 Highmeadow Ln
- 10216 Meadow Glen Dr
- 10216 Meadow Glen Dr Unit 78
- 10208 Meadow Glen Dr
- 10208 Meadow Glen Dr Unit 108
- 10197 Meadow Glen Dr
- 10197 Meadow Glen Dr Unit 103
- 10204 Meadow Glen Dr
- 10224 Meadow Glen Dr
- 10214 Highmeadow Ln
- 10225 Meadow Glen Dr