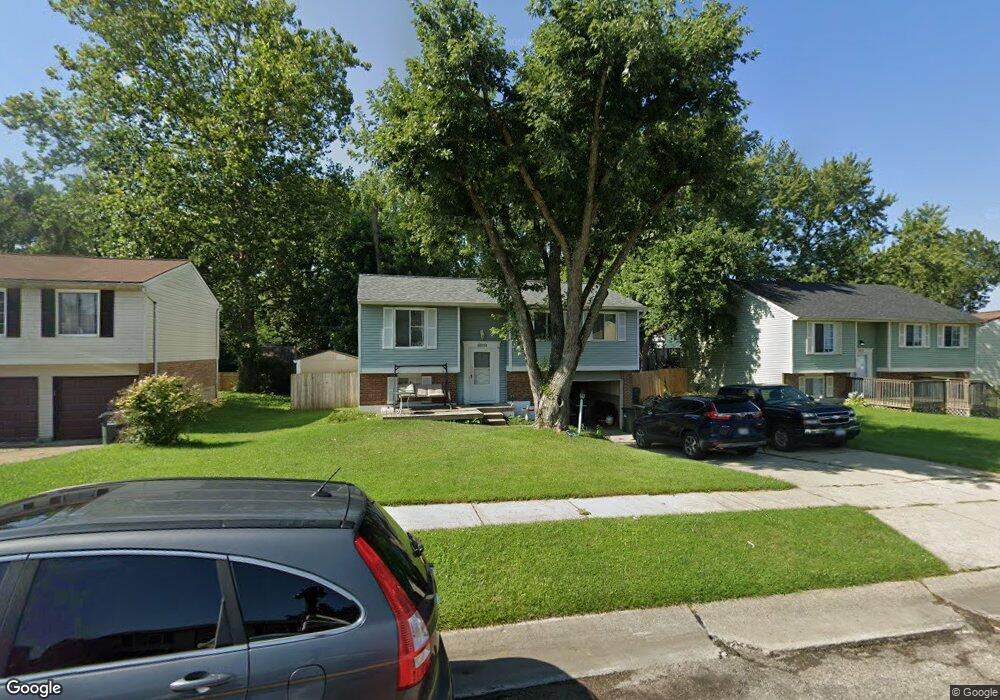
10213 Snowflake Ln Cincinnati, OH 45251
Northgate NeighborhoodEstimated Value: $223,463 - $252,000
3
Beds
2
Baths
1,500
Sq Ft
$156/Sq Ft
Est. Value
About This Home
This home is located at 10213 Snowflake Ln, Cincinnati, OH 45251 and is currently estimated at $233,616, approximately $155 per square foot. 10213 Snowflake Ln is a home located in Hamilton County with nearby schools including Mt Healthy High School, Hamilton County Mathematics and Science Academy, and Central Montessori Academy.
Ownership History
Date
Name
Owned For
Owner Type
Purchase Details
Closed on
Jun 15, 2000
Sold by
Calai Charles J and Slone Kimberly
Bought by
Calai Charles J and Calai Kimberly M
Current Estimated Value
Home Financials for this Owner
Home Financials are based on the most recent Mortgage that was taken out on this home.
Original Mortgage
$110,000
Outstanding Balance
$36,761
Interest Rate
8.31%
Estimated Equity
$196,855
Purchase Details
Closed on
Jul 14, 1999
Sold by
Calai Charles J and Slone Kimberly M
Bought by
Calai Charles J and Calai Kimberly M
Home Financials for this Owner
Home Financials are based on the most recent Mortgage that was taken out on this home.
Original Mortgage
$78,500
Interest Rate
7.43%
Mortgage Type
FHA
Purchase Details
Closed on
Aug 17, 1996
Sold by
Ziska Mark A and Ziska Pamela B
Bought by
Calai Charles J and Slone Kimberly M
Home Financials for this Owner
Home Financials are based on the most recent Mortgage that was taken out on this home.
Original Mortgage
$79,600
Interest Rate
8%
Mortgage Type
FHA
Create a Home Valuation Report for This Property
The Home Valuation Report is an in-depth analysis detailing your home's value as well as a comparison with similar homes in the area
Home Values in the Area
Average Home Value in this Area
Purchase History
| Date | Buyer | Sale Price | Title Company |
|---|---|---|---|
| Calai Charles J | -- | First Service Title Agency I | |
| Calai Charles J | -- | Chicago Title | |
| Calai Charles J | $79,500 | -- |
Source: Public Records
Mortgage History
| Date | Status | Borrower | Loan Amount |
|---|---|---|---|
| Open | Calai Charles J | $110,000 | |
| Closed | Calai Charles J | $78,500 | |
| Previous Owner | Calai Charles J | $79,600 |
Source: Public Records
Tax History
| Year | Tax Paid | Tax Assessment Tax Assessment Total Assessment is a certain percentage of the fair market value that is determined by local assessors to be the total taxable value of land and additions on the property. | Land | Improvement |
|---|---|---|---|---|
| 2025 | $3,187 | $57,985 | $7,245 | $50,740 |
| 2023 | $3,055 | $57,985 | $7,245 | $50,740 |
| 2022 | $2,400 | $33,114 | $6,612 | $26,502 |
| 2021 | $2,388 | $33,114 | $6,612 | $26,502 |
| 2020 | $2,355 | $33,114 | $6,612 | $26,502 |
| 2019 | $2,180 | $28,064 | $5,604 | $22,460 |
| 2018 | $2,192 | $28,064 | $5,604 | $22,460 |
| 2017 | $2,107 | $28,064 | $5,604 | $22,460 |
| 2016 | $2,160 | $28,141 | $7,109 | $21,032 |
| 2015 | $2,141 | $28,141 | $7,109 | $21,032 |
| 2014 | $2,126 | $28,141 | $7,109 | $21,032 |
| 2013 | $2,221 | $30,590 | $7,728 | $22,862 |
Source: Public Records
Map
Nearby Homes
- 10220 Windswept Ln
- 10044 Crusader Dr
- 10123 Manistee Way
- 10086 Windswept Ln
- 3250 Springdale Rd
- 2752 Mancelona Ct
- 10311 September Dr
- 2792 Wheatfield Dr
- 10073 Pippin Rd
- 2788 Hazelton Ct
- 10324 Mae Ct
- 10328 Mae Ct
- 10332 Mae Ct
- 10316 Mae Ct
- 10336 Mae Ct
- 10312 Mae Ct
- 10304 Mae Ct
- 2585 Fulbourne Dr
- 10366 Pippin Ln
- 10372 Pippin Ln
- 10217 Snowflake Ln
- 10209 Snowflake Ln
- 3015 Snowvalley Ct
- 10205 Snowflake Ln
- 3007 Snowvalley Ct
- 3021 Snowvalley Ct
- 10210 Snowflake Ln
- 10216 Snowflake Ln
- 10222 Snowflake Ln
- 10201 Snowflake Ln
- 10202 Snowflake Ln
- 10197 Snowflake Ln
- 10230 Snowflake Ln
- 3025 Snowvalley Ct
- 3004 Snowvalley Ct
- 10178 Snowflake Ln
- 10170 Snowflake Ln
- 3008 Snowvalley Ct
- 10168 Snowflake Ln
- 10193 Snowflake Ln
Your Personal Tour Guide
Ask me questions while you tour the home.