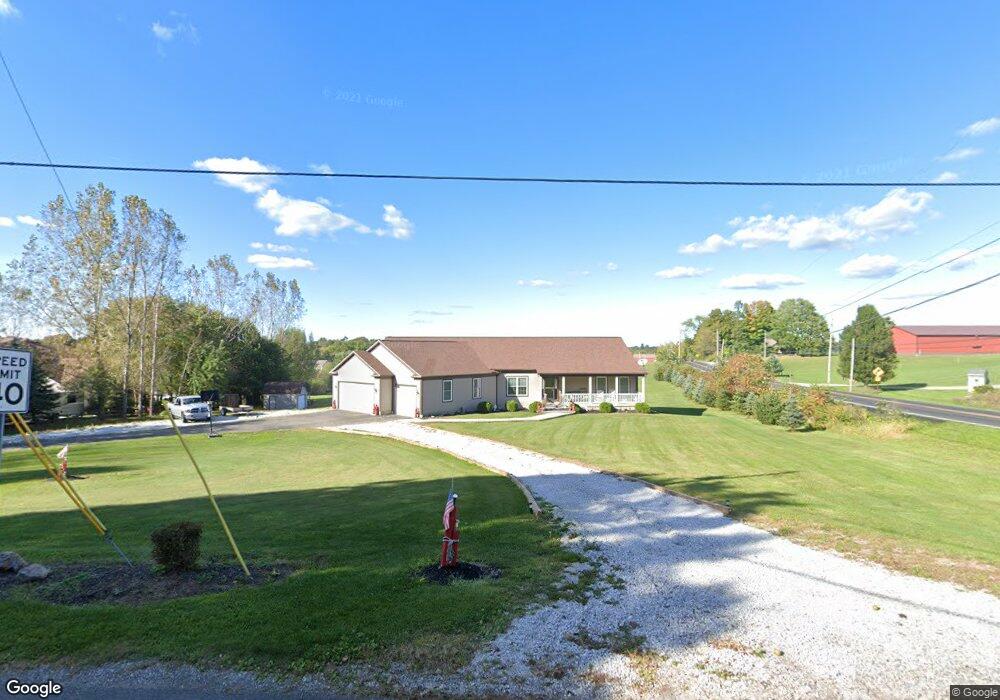
10214 Halstead Rd Mantua, OH 44255
Estimated Value: $410,000 - $514,000
4
Beds
3
Baths
2,364
Sq Ft
$198/Sq Ft
Est. Value
About This Home
This home is located at 10214 Halstead Rd, Mantua, OH 44255 and is currently estimated at $467,516, approximately $197 per square foot. 10214 Halstead Rd is a home with nearby schools including Crestwood Primary School, Crestwood Intermediate School, and Crestwood Middle School.
Ownership History
Date
Name
Owned For
Owner Type
Purchase Details
Closed on
Mar 15, 2012
Sold by
Rivett David H
Bought by
Rivett David H and Rivett Santa Paulette
Current Estimated Value
Home Financials for this Owner
Home Financials are based on the most recent Mortgage that was taken out on this home.
Original Mortgage
$313,557
Interest Rate
3.75%
Mortgage Type
FHA
Purchase Details
Closed on
Jan 21, 2011
Sold by
Baran Daniel E and Baran Kathleen M
Bought by
Rivett David H
Home Financials for this Owner
Home Financials are based on the most recent Mortgage that was taken out on this home.
Original Mortgage
$311,888
Interest Rate
4.65%
Mortgage Type
Construction
Purchase Details
Closed on
Feb 20, 2008
Sold by
Burke James C and Burke Cheryl A
Bought by
Baran Daniel E and Rivett Kathleen M
Home Financials for this Owner
Home Financials are based on the most recent Mortgage that was taken out on this home.
Original Mortgage
$34,875
Interest Rate
5.25%
Mortgage Type
Purchase Money Mortgage
Create a Home Valuation Report for This Property
The Home Valuation Report is an in-depth analysis detailing your home's value as well as a comparison with similar homes in the area
Home Values in the Area
Average Home Value in this Area
Purchase History
| Date | Buyer | Sale Price | Title Company |
|---|---|---|---|
| Rivett David H | -- | Chicago Title | |
| Rivett David H | -- | Attorney | |
| Baran Daniel E | $46,500 | Portage Title Agency |
Source: Public Records
Mortgage History
| Date | Status | Borrower | Loan Amount |
|---|---|---|---|
| Previous Owner | Rivett David H | $313,557 | |
| Previous Owner | Rivett David H | $311,888 | |
| Previous Owner | Baran Daniel E | $34,875 |
Source: Public Records
Tax History Compared to Growth
Tax History
| Year | Tax Paid | Tax Assessment Tax Assessment Total Assessment is a certain percentage of the fair market value that is determined by local assessors to be the total taxable value of land and additions on the property. | Land | Improvement |
|---|---|---|---|---|
| 2024 | $5,576 | $142,450 | $16,170 | $126,280 |
| 2023 | $4,824 | $112,420 | $11,340 | $101,080 |
| 2022 | $4,880 | $112,420 | $11,340 | $101,080 |
| 2021 | $4,931 | $112,420 | $11,340 | $101,080 |
| 2020 | $4,251 | $91,560 | $11,340 | $80,220 |
| 2019 | $4,196 | $91,560 | $11,340 | $80,220 |
| 2018 | $3,890 | $83,030 | $13,060 | $69,970 |
| 2017 | $3,890 | $83,030 | $13,060 | $69,970 |
| 2016 | $3,879 | $83,030 | $13,060 | $69,970 |
| 2015 | $3,887 | $83,030 | $13,060 | $69,970 |
| 2014 | $3,966 | $83,030 | $13,060 | $69,970 |
| 2013 | $3,924 | $83,030 | $13,060 | $69,970 |
Source: Public Records
Map
Nearby Homes
- 2785 Fairfax St
- 10389 Wentworth Rd
- 10306 Winthrop Rd
- 2653 Fairfax St
- 0 Infirmary Rd
- 11166 Loris Ave
- 9416 Kieffer Rd
- 3070 Polly Rd
- 2887 Shelly Rd
- 9329 Infirmary Rd Unit B1
- 9905 Creekside Way
- 4364 Pioneer Trail
- 1863 Dunlap Dr
- 9741 Eagle Ln Unit 9741
- 1543 Manfrass Dr
- 200 Greentree Cir
- 1612 Mids Ct
- 9091 State Route 44
- 11131 State Route 44
- 4437 State Route 303
- 10234 Halstead Rd
- 10295 Diagonal Rd
- 10254 Halstead Rd
- 10355 Diagonal Rd
- 10328 Diagonal Rd
- 10261 Diagonal Rd
- 10274 Halstead Rd
- 10261 Halstead Rd
- 10374 Diagonal Rd
- 10362 Diagonal Rd
- 10287 Halstead Rd
- 10296 Halstead Rd
- 3200 Bartlett Rd
- 3218 Bartlett Rd
- 10308 Halstead Rd
- 10295 Halstead Rd
- 10233 Diagonal Rd
- 3190 Bartlett Rd
- 3242 Bartlett Rd
- 3182 Bartlett Rd