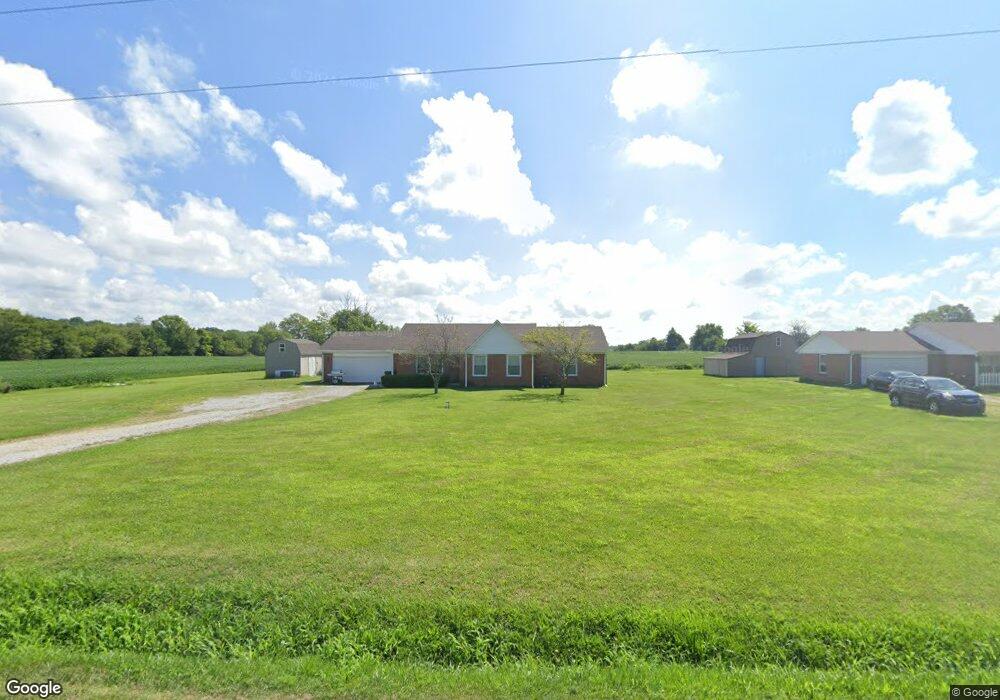
10216 N 150 E Morristown, IN 46161
Estimated Value: $227,000 - $338,000
4
Beds
2
Baths
2,139
Sq Ft
$144/Sq Ft
Est. Value
About This Home
This home is located at 10216 N 150 E, Morristown, IN 46161 and is currently estimated at $308,305, approximately $144 per square foot. 10216 N 150 E is a home located in Shelby County with nearby schools including Morristown Elementary School and Morristown Junior/Senior High School.
Ownership History
Date
Name
Owned For
Owner Type
Purchase Details
Closed on
Apr 3, 2018
Sold by
Knudson Terry R
Bought by
Viking Property & Land Llc
Current Estimated Value
Purchase Details
Closed on
Oct 25, 2017
Sold by
Hart Suzanne Catherine
Bought by
Knudson Terry R
Home Financials for this Owner
Home Financials are based on the most recent Mortgage that was taken out on this home.
Original Mortgage
$157,500
Interest Rate
3.78%
Mortgage Type
Commercial
Create a Home Valuation Report for This Property
The Home Valuation Report is an in-depth analysis detailing your home's value as well as a comparison with similar homes in the area
Purchase History
| Date | Buyer | Sale Price | Title Company |
|---|---|---|---|
| Viking Property & Land Llc | -- | None Available | |
| Knudson Terry R | -- | None Available |
Source: Public Records
Mortgage History
| Date | Status | Borrower | Loan Amount |
|---|---|---|---|
| Previous Owner | Knudson Terry R | $157,500 |
Source: Public Records
Tax History
| Year | Tax Paid | Tax Assessment Tax Assessment Total Assessment is a certain percentage of the fair market value that is determined by local assessors to be the total taxable value of land and additions on the property. | Land | Improvement |
|---|---|---|---|---|
| 2024 | $2,223 | $141,800 | $39,800 | $102,000 |
| 2023 | $2,274 | $141,800 | $40,800 | $101,000 |
| 2022 | $1,996 | $122,900 | $36,300 | $86,600 |
| 2021 | $1,976 | $122,900 | $28,900 | $94,000 |
| 2020 | $1,919 | $122,900 | $29,200 | $93,700 |
| 2019 | $1,509 | $95,500 | $24,300 | $71,200 |
| 2018 | $2,946 | $188,700 | $51,500 | $137,200 |
| 2017 | $1,328 | $166,500 | $51,500 | $115,000 |
| 2016 | $1,273 | $170,700 | $51,500 | $119,200 |
| 2014 | $1,139 | $163,200 | $50,400 | $112,800 |
| 2013 | $1,139 | $158,400 | $49,800 | $108,600 |
Source: Public Records
Map
Nearby Homes
- 256 E 1000 N
- 11131 N State Road 9
- 2882 E Cottonwood Trail
- 10618 N 300 E
- 2903 E Freeport Rd
- 11761 N 100 E
- 8825 N 300 E
- 0 S 300 East- 2
- 83 E Walnut St
- 956 W 1085 N
- 657 W Brookville Rd
- 632 S Washington St
- 6 U S 52
- 5 U S 52
- 5681 S 500 E
- 1546 E Osprey Dr
- 3192 E 400 S
- 5495 E US Highway 52
- 0 S 50 West S
- 661 W 500 S
Your Personal Tour Guide
Ask me questions while you tour the home.