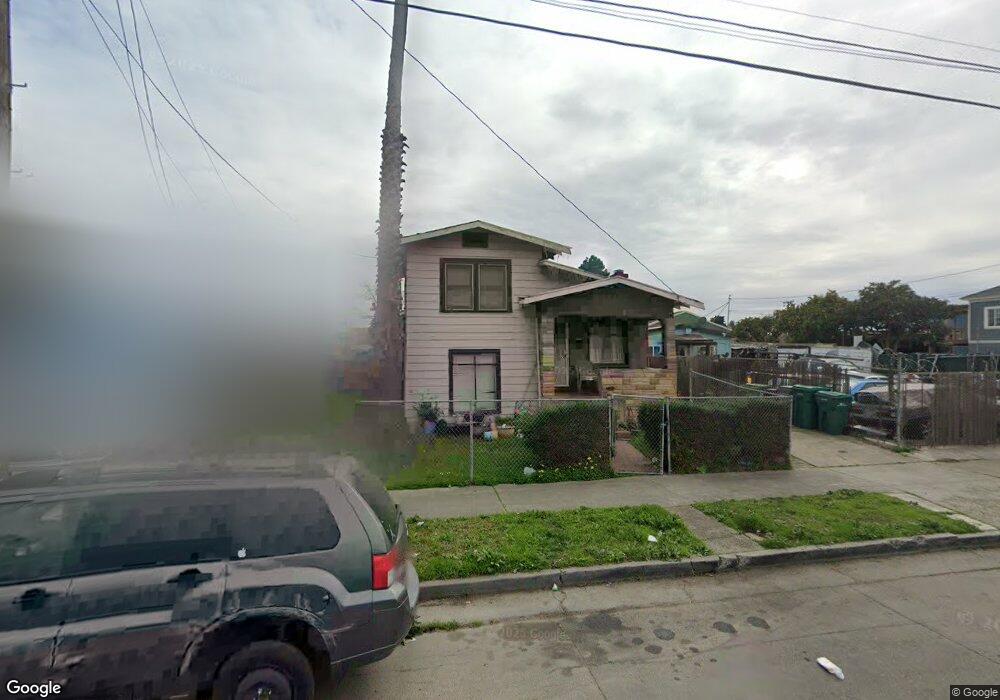
1022 89th Ave Oakland, CA 94621
Highland NeighborhoodEstimated Value: $456,594 - $508,000
4
Beds
2
Baths
1,452
Sq Ft
$333/Sq Ft
Est. Value
About This Home
This home is located at 1022 89th Ave, Oakland, CA 94621 and is currently estimated at $482,865, approximately $332 per square foot. 1022 89th Ave is a home located in Alameda County with nearby schools including New Highland Academy, Encompass Academy Elementary, and Acorn Woodland Elementary School.
Ownership History
Date
Name
Owned For
Owner Type
Purchase Details
Closed on
Apr 17, 2025
Sold by
Lang Deng and Qian Li Qian
Bought by
Lang Deng & Qian Li Trust and Li
Current Estimated Value
Purchase Details
Closed on
Jan 8, 2013
Sold by
Liming Scott
Bought by
Deng Lang and Li Qian
Purchase Details
Closed on
Oct 16, 2012
Sold by
Cook Christopher D
Bought by
Liming Scott
Purchase Details
Closed on
Feb 7, 2012
Sold by
Cook Christopher D
Bought by
Liming Scott
Purchase Details
Closed on
Apr 2, 2008
Sold by
Mcgowen Karen D
Bought by
Cook Chris
Purchase Details
Closed on
Mar 28, 2008
Sold by
Cook Natalie M
Bought by
Cook Chris
Purchase Details
Closed on
Jan 6, 2005
Sold by
Thompson Jessie M
Bought by
Mcgowen Karen D
Home Financials for this Owner
Home Financials are based on the most recent Mortgage that was taken out on this home.
Original Mortgage
$262,500
Interest Rate
6.4%
Mortgage Type
Purchase Money Mortgage
Create a Home Valuation Report for This Property
The Home Valuation Report is an in-depth analysis detailing your home's value as well as a comparison with similar homes in the area
Home Values in the Area
Average Home Value in this Area
Purchase History
| Date | Buyer | Sale Price | Title Company |
|---|---|---|---|
| Lang Deng & Qian Li Trust | $130,000 | North American Title | |
| Deng Lang | $130,000 | North American Title Company | |
| Liming Scott | $125,000 | None Available | |
| Liming Scott | $172,200 | None Available | |
| Cook Chris | $300,000 | Financial Title Company | |
| Cook Chris | -- | Financial Title Company | |
| Mcgowen Karen D | -- | Placer Title Company |
Source: Public Records
Mortgage History
| Date | Status | Borrower | Loan Amount |
|---|---|---|---|
| Previous Owner | Mcgowen Karen D | $262,500 |
Source: Public Records
Tax History
| Year | Tax Paid | Tax Assessment Tax Assessment Total Assessment is a certain percentage of the fair market value that is determined by local assessors to be the total taxable value of land and additions on the property. | Land | Improvement |
|---|---|---|---|---|
| 2025 | $3,833 | $153,921 | $46,176 | $107,745 |
| 2024 | $3,833 | $150,904 | $45,271 | $105,633 |
| 2023 | $3,904 | $147,945 | $44,383 | $103,562 |
| 2022 | $3,735 | $145,045 | $43,513 | $101,532 |
| 2021 | $3,438 | $142,201 | $42,660 | $99,541 |
| 2020 | $3,396 | $140,744 | $42,223 | $98,521 |
| 2019 | $3,184 | $137,985 | $41,395 | $96,590 |
| 2018 | $3,119 | $135,280 | $40,584 | $94,696 |
| 2017 | $2,969 | $132,628 | $39,788 | $92,840 |
| 2016 | $2,789 | $130,028 | $39,008 | $91,020 |
| 2015 | $2,769 | $128,075 | $38,422 | $89,653 |
| 2014 | $2,651 | $125,567 | $37,670 | $87,897 |
Source: Public Records
Map
Nearby Homes
Your Personal Tour Guide
Ask me questions while you tour the home.