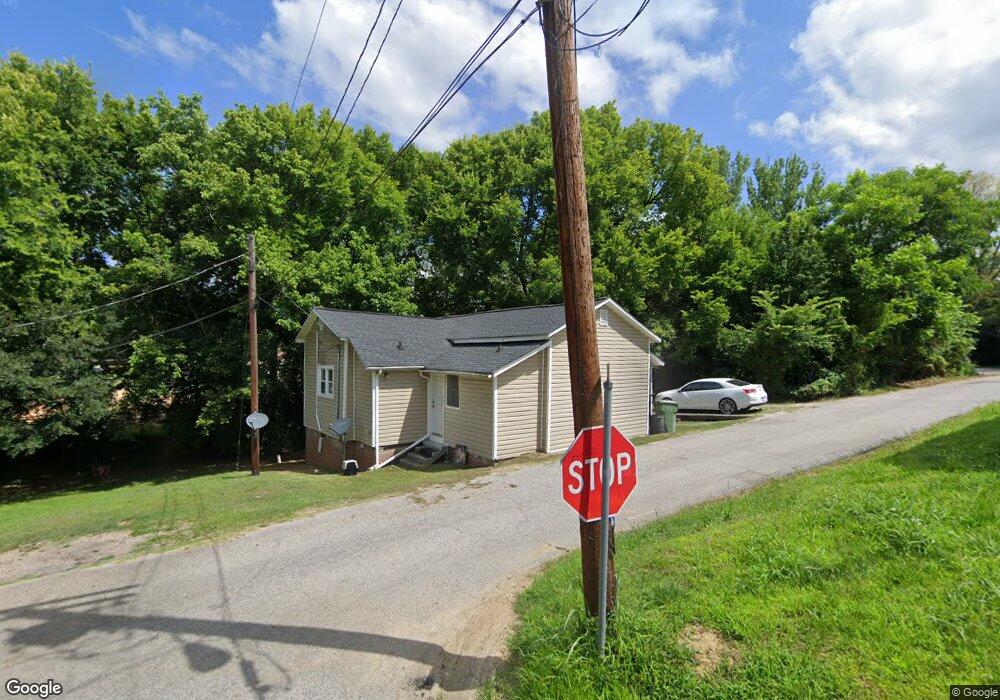
1022 Cross St Lancaster, SC 29720
Estimated Value: $102,000 - $128,000
Studio
1
Bath
763
Sq Ft
$151/Sq Ft
Est. Value
About This Home
This home is located at 1022 Cross St, Lancaster, SC 29720 and is currently estimated at $115,000, approximately $150 per square foot. 1022 Cross St is a home located in Lancaster County with nearby schools including Brooklyn Springs Elementary School, Buford Middle School, and Lancaster High School.
Ownership History
Date
Name
Owned For
Owner Type
Purchase Details
Closed on
Aug 18, 2017
Sold by
Kerns Roger B and Kerns Roger
Bought by
Lane Benjamin C and Lane Jennifer M
Current Estimated Value
Home Financials for this Owner
Home Financials are based on the most recent Mortgage that was taken out on this home.
Original Mortgage
$256,000
Outstanding Balance
$214,014
Interest Rate
4.03%
Mortgage Type
Future Advance Clause Open End Mortgage
Estimated Equity
-$99,014
Purchase Details
Closed on
Aug 17, 2006
Sold by
Branch Banking & Trust Co Of Sc
Bought by
Kerns Roger
Purchase Details
Closed on
Aug 2, 2005
Sold by
Rinehart Robert Kyle
Bought by
Branch Banking & Trust Co Of Sc
Purchase Details
Closed on
May 22, 2003
Sold by
Real Estate Investment Capital Inc
Bought by
Rinehart Robert Kyle
Purchase Details
Closed on
May 21, 2003
Sold by
Glassberg William F and Glassberg Diane J
Bought by
Real Estate Investment Capital Inc
Create a Home Valuation Report for This Property
The Home Valuation Report is an in-depth analysis detailing your home's value as well as a comparison with similar homes in the area
Home Values in the Area
Average Home Value in this Area
Purchase History
| Date | Buyer | Sale Price | Title Company |
|---|---|---|---|
| Lane Benjamin C | $320,000 | None Available | |
| Kerns Roger | $7,000 | None Available | |
| Branch Banking & Trust Co Of Sc | $500 | -- | |
| Rinehart Robert Kyle | $105,000 | -- | |
| Real Estate Investment Capital Inc | $75,000 | -- |
Source: Public Records
Mortgage History
| Date | Status | Borrower | Loan Amount |
|---|---|---|---|
| Open | Lane Benjamin C | $256,000 |
Source: Public Records
Tax History
| Year | Tax Paid | Tax Assessment Tax Assessment Total Assessment is a certain percentage of the fair market value that is determined by local assessors to be the total taxable value of land and additions on the property. | Land | Improvement |
|---|---|---|---|---|
| 2024 | $179 | $540 | $138 | $402 |
| 2023 | $179 | $540 | $138 | $402 |
| 2022 | $178 | $540 | $138 | $402 |
| 2021 | $175 | $540 | $138 | $402 |
| 2020 | $156 | $480 | $138 | $342 |
| 2019 | $162 | $480 | $138 | $342 |
| 2018 | $156 | $480 | $138 | $342 |
| 2017 | $147 | $0 | $0 | $0 |
| 2016 | $145 | $0 | $0 | $0 |
| 2015 | $127 | $0 | $0 | $0 |
| 2014 | $127 | $0 | $0 | $0 |
| 2013 | $127 | $0 | $0 | $0 |
Source: Public Records
Map
Nearby Homes
Your Personal Tour Guide
Ask me questions while you tour the home.