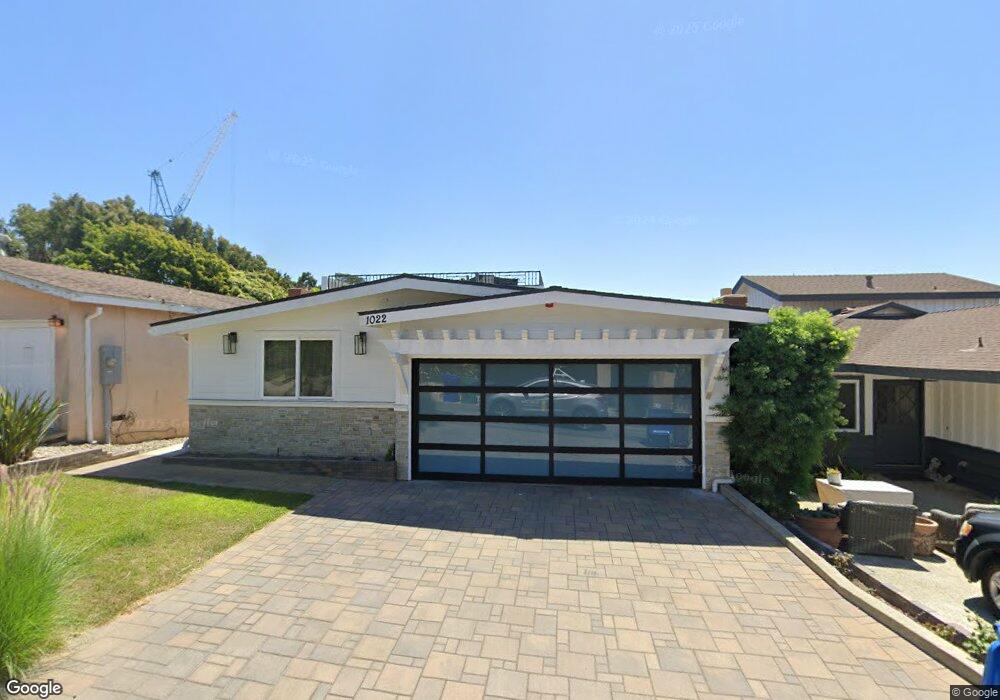
1022 Duncan Place Manhattan Beach, CA 90266
Estimated Value: $2,642,000 - $3,354,000
3
Beds
2
Baths
2,085
Sq Ft
$1,448/Sq Ft
Est. Value
About This Home
This home is located at 1022 Duncan Place, Manhattan Beach, CA 90266 and is currently estimated at $3,019,566, approximately $1,448 per square foot. 1022 Duncan Place is a home located in Los Angeles County with nearby schools including Opal Robinson Elementary School, Manhattan Beach Middle School, and Mira Costa High School.
Ownership History
Date
Name
Owned For
Owner Type
Purchase Details
Closed on
Sep 1, 2020
Sold by
Pagola Frank and Pagola Yacinta N
Bought by
Pagola Frank and Pagola Yacinta Nanik
Current Estimated Value
Purchase Details
Closed on
Apr 17, 2011
Sold by
Hansen Robert K and Hansen Sandra J
Bought by
Pagola Frank and Pagola Yacinta N
Home Financials for this Owner
Home Financials are based on the most recent Mortgage that was taken out on this home.
Original Mortgage
$417,000
Outstanding Balance
$287,060
Interest Rate
4.83%
Mortgage Type
New Conventional
Estimated Equity
$2,732,506
Purchase Details
Closed on
Jan 31, 2008
Sold by
Hansen Robert Kent and Teague Terri L
Bought by
Hansen Robert K
Create a Home Valuation Report for This Property
The Home Valuation Report is an in-depth analysis detailing your home's value as well as a comparison with similar homes in the area
Home Values in the Area
Average Home Value in this Area
Purchase History
| Date | Buyer | Sale Price | Title Company |
|---|---|---|---|
| Pagola Frank | -- | None Available | |
| Pagola Frank | $850,000 | Provident Title Company | |
| Hansen Robert K | -- | None Available |
Source: Public Records
Mortgage History
| Date | Status | Borrower | Loan Amount |
|---|---|---|---|
| Open | Pagola Frank | $417,000 |
Source: Public Records
Tax History
| Year | Tax Paid | Tax Assessment Tax Assessment Total Assessment is a certain percentage of the fair market value that is determined by local assessors to be the total taxable value of land and additions on the property. | Land | Improvement |
|---|---|---|---|---|
| 2025 | $15,626 | $1,145,511 | $704,641 | $440,870 |
| 2024 | $14,229 | $1,123,051 | $690,825 | $432,226 |
| 2023 | $15,076 | $1,101,031 | $677,280 | $423,751 |
| 2022 | $14,855 | $1,079,443 | $664,000 | $415,443 |
| 2021 | $14,663 | $1,058,279 | $650,981 | $407,298 |
| 2020 | $14,545 | $1,047,428 | $644,306 | $403,122 |
| 2019 | $12,020 | $1,026,891 | $631,673 | $395,218 |
| 2018 | $11,754 | $1,006,757 | $619,288 | $387,469 |
| 2016 | $10,822 | $967,666 | $595,242 | $372,424 |
| 2015 | $10,598 | $953,131 | $586,301 | $366,830 |
| 2014 | $10,454 | $934,462 | $574,817 | $359,645 |
Source: Public Records
Map
Nearby Homes
- 2965 La Carlita St
- 215 S Poinsettia Ave
- 626 Longfellow Ave
- 2900 Hermosa View Dr
- 649 Gould Terrace
- 436 1st St
- 1320 Curtis Ave
- 736 Gould Ave Unit 13
- 98 Highland Ave
- 927 9th St
- 2411 Prospect Ave Unit 112
- 2411 Prospect Ave Unit 214
- 231 Longfellow Ave
- 621 6th St
- 89 Bayview Dr
- 2121 Pacific Coast Hwy
- 633 21st St
- 212 Manhattan Ave
- 1500 2nd St
- 2526 Hermosa Ave
- 1018 Duncan Place
- 1030 Duncan Place
- 1017 Duncan Place
- 1023 Duncan Ave
- 1025 Duncan Place
- 1019 Duncan Ave
- 1034 Duncan Place
- 1031 Duncan Ave
- 1031 Duncan Place
- 206 S Dianthus St
- 200 S Dianthus St
- 1035 Duncan Ave
- 210 S Dianthus St
- 250 S Dianthus St
- 118 S Dianthus St
- 1018 1st St
- 112 S Dianthus St
- 1014 1st St
- 1022 1st St
- 1030 1st St
Your Personal Tour Guide
Ask me questions while you tour the home.