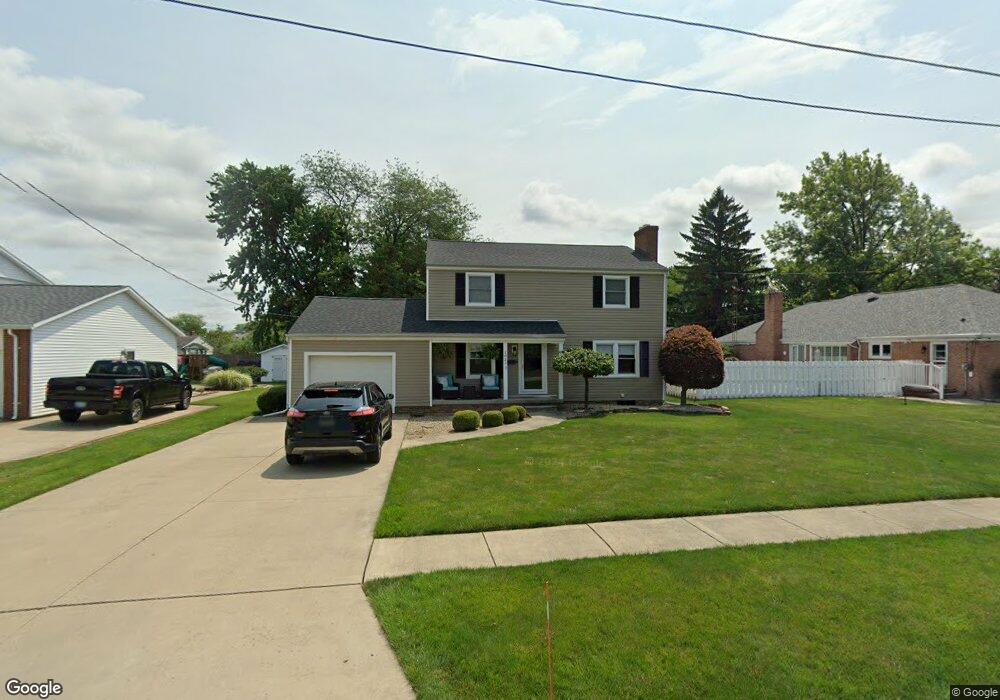
1022 Northwest St Bellevue, OH 44811
Estimated Value: $157,000 - $260,000
4
Beds
2
Baths
1,792
Sq Ft
$121/Sq Ft
Est. Value
About This Home
This home is located at 1022 Northwest St, Bellevue, OH 44811 and is currently estimated at $216,624, approximately $120 per square foot. 1022 Northwest St is a home located in Huron County with nearby schools including Bellevue Elementary School, Bellevue Middle School, and Bellevue High School.
Ownership History
Date
Name
Owned For
Owner Type
Purchase Details
Closed on
Sep 14, 2017
Sold by
Santoro Kory A and Santoro Maribeth
Bought by
Hirt Joshua K and Hirt Alysha N
Current Estimated Value
Home Financials for this Owner
Home Financials are based on the most recent Mortgage that was taken out on this home.
Original Mortgage
$187,540
Outstanding Balance
$156,735
Interest Rate
3.93%
Mortgage Type
FHA
Estimated Equity
$59,889
Purchase Details
Closed on
Nov 3, 1998
Sold by
Rohlf Jon C
Bought by
Santoro Kory A and Santoro Marybeth
Home Financials for this Owner
Home Financials are based on the most recent Mortgage that was taken out on this home.
Original Mortgage
$124,450
Interest Rate
6.78%
Mortgage Type
New Conventional
Purchase Details
Closed on
Apr 26, 1988
Bought by
Rohlf Jon C
Create a Home Valuation Report for This Property
The Home Valuation Report is an in-depth analysis detailing your home's value as well as a comparison with similar homes in the area
Home Values in the Area
Average Home Value in this Area
Purchase History
| Date | Buyer | Sale Price | Title Company |
|---|---|---|---|
| Hirt Joshua K | $191,000 | First American Title | |
| Santoro Kory A | $131,000 | -- | |
| Rohlf Jon C | -- | -- |
Source: Public Records
Mortgage History
| Date | Status | Borrower | Loan Amount |
|---|---|---|---|
| Open | Hirt Joshua K | $187,540 | |
| Previous Owner | Santoro Kory A | $124,450 |
Source: Public Records
Tax History Compared to Growth
Tax History
| Year | Tax Paid | Tax Assessment Tax Assessment Total Assessment is a certain percentage of the fair market value that is determined by local assessors to be the total taxable value of land and additions on the property. | Land | Improvement |
|---|---|---|---|---|
| 2024 | $2,747 | $67,550 | $8,570 | $58,980 |
| 2023 | $2,747 | $58,290 | $5,250 | $53,040 |
| 2022 | $2,513 | $58,290 | $5,250 | $53,040 |
| 2021 | $2,534 | $58,290 | $5,250 | $53,040 |
| 2020 | $2,340 | $50,880 | $5,250 | $45,630 |
| 2019 | $2,308 | $50,880 | $5,250 | $45,630 |
| 2018 | $2,277 | $50,880 | $5,250 | $45,630 |
| 2017 | $2,019 | $46,310 | $5,040 | $41,270 |
| 2016 | $1,971 | $46,310 | $5,040 | $41,270 |
| 2015 | $2,015 | $46,310 | $5,040 | $41,270 |
| 2014 | $1,839 | $41,020 | $5,040 | $35,980 |
| 2013 | $1,818 | $41,020 | $5,040 | $35,980 |
Source: Public Records
Map
Nearby Homes
- 124 Sunset Dr
- 819 Castalia St
- 808 Castalia St
- 303 Moore Ave
- 130 Huffman St
- 219 Huffman St
- 126 Greenwood Heights
- 408 W Main St
- 140 Harkness St
- 206 Southwest St
- 118 Maplewood
- 0 Oakwood Dr
- 129 Hamilton St
- 150 Redwood Dr
- 231 Lawrence St
- 230 Highland Ave Unit 106
- 154 Ashford Ave
- 0 County Road 308
- 155 Ashford Ave
- 501 E Center St
- 1032 Northwest St
- 101 Sunset Dr
- 111 Sunset Dr
- 112 Arlington Dr
- 108 Arlington Dr
- 116 Arlington Dr
- 1016 County Road 312
- 980 Northwest St
- 119 Sunset Dr
- 120 Arlington Dr
- 125 Sunset Dr
- 110 Sunset Dr
- 970 Northwest St
- 126 Arlington Dr
- 114 Sunset Dr
- 107 Arlington Dr
- 129 Sunset Dr
- 103 Arlington Dr
- 118 Sunset Dr
- 111 Arlington Dr