Estimated Value: $131,000 - $159,000
2
Beds
1
Bath
880
Sq Ft
$162/Sq Ft
Est. Value
About This Home
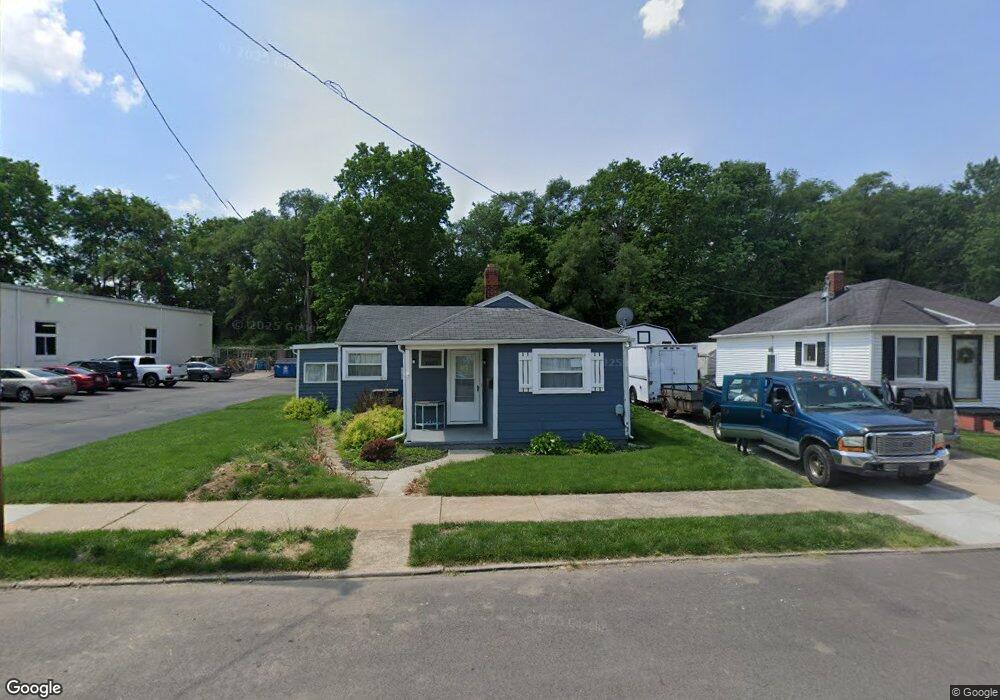
This home is located at 1022 Race Dr, Troy, OH 45373 and is currently estimated at $142,195, approximately $161 per square foot. 1022 Race Dr is a home located in Miami County with nearby schools including Forest Elementary School, Van Cleve Elementary School, and Troy Junior High School.
Ownership History
Date
Name
Owned For
Owner Type
Purchase Details
Closed on
Apr 5, 2017
Sold by
Mowery Cheryl L and Clutter Stephen J
Bought by
J And C Wendling Llc
Current Estimated Value
Purchase Details
Closed on
Apr 27, 2015
Sold by
Mowery Cheryl L and Clutter Stephen J
Bought by
Wendling Joseph M and Wendling Colleen Q
Home Financials for this Owner
Home Financials are based on the most recent Mortgage that was taken out on this home.
Original Mortgage
$47,417
Interest Rate
3.77%
Mortgage Type
Seller Take Back
Purchase Details
Closed on
Feb 11, 2008
Sold by
Jones Henry W and Jones Janet J
Bought by
Mowery Cheryl L
Purchase Details
Closed on
Dec 1, 1983
Bought by
Jones Henry W
Create a Home Valuation Report for This Property
The Home Valuation Report is an in-depth analysis detailing your home's value as well as a comparison with similar homes in the area
Home Values in the Area
Average Home Value in this Area
Purchase History
| Date | Buyer | Sale Price | Title Company |
|---|---|---|---|
| J And C Wendling Llc | $57,500 | None Available | |
| Wendling Joseph M | $57,417 | Attorney | |
| Mowery Cheryl L | $48,000 | -- | |
| Jones Henry W | -- | -- |
Source: Public Records
Mortgage History
| Date | Status | Borrower | Loan Amount |
|---|---|---|---|
| Previous Owner | Wendling Joseph M | $47,417 |
Source: Public Records
Tax History Compared to Growth
Tax History
| Year | Tax Paid | Tax Assessment Tax Assessment Total Assessment is a certain percentage of the fair market value that is determined by local assessors to be the total taxable value of land and additions on the property. | Land | Improvement |
|---|---|---|---|---|
| 2024 | $1,127 | $29,200 | $9,840 | $19,360 |
| 2023 | $1,127 | $29,200 | $9,840 | $19,360 |
| 2022 | $943 | $29,200 | $9,840 | $19,360 |
| 2021 | $794 | $23,350 | $7,880 | $15,470 |
| 2020 | $795 | $23,350 | $7,880 | $15,470 |
| 2019 | $802 | $23,350 | $7,880 | $15,470 |
| 2018 | $751 | $21,010 | $8,510 | $12,500 |
| 2017 | $739 | $21,010 | $8,510 | $12,500 |
| 2016 | $727 | $21,010 | $8,510 | $12,500 |
| 2015 | $704 | $19,470 | $7,880 | $11,590 |
| 2014 | $704 | $19,470 | $7,880 | $11,590 |
| 2013 | $708 | $19,470 | $7,880 | $11,590 |
Source: Public Records
Map
Nearby Homes