Estimated Value: $369,000 - $407,175
3
Beds
3
Baths
1,270
Sq Ft
$310/Sq Ft
Est. Value
About This Home
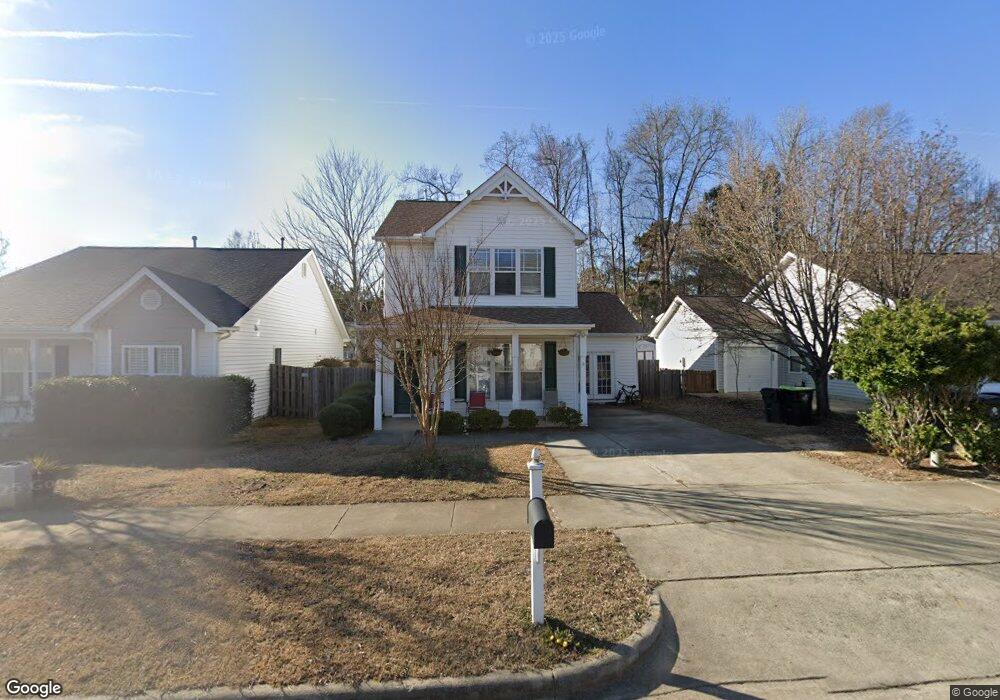
This home is located at 1022 Shackleton Rd, Apex, NC 27502 and is currently estimated at $394,044, approximately $310 per square foot. 1022 Shackleton Rd is a home located in Wake County with nearby schools including Apex Elementary School, Apex Middle, and Apex High School.
Ownership History
Date
Name
Owned For
Owner Type
Purchase Details
Closed on
Oct 13, 2011
Sold by
Champ Barry E and Champ Andrea G
Bought by
Huang Shaohua and Huang Biying
Current Estimated Value
Home Financials for this Owner
Home Financials are based on the most recent Mortgage that was taken out on this home.
Original Mortgage
$101,250
Outstanding Balance
$9,168
Interest Rate
3.41%
Mortgage Type
New Conventional
Estimated Equity
$384,876
Purchase Details
Closed on
Sep 14, 2004
Sold by
Homeplaces Llc
Bought by
Champ Barry E and Champ Andrea G
Home Financials for this Owner
Home Financials are based on the most recent Mortgage that was taken out on this home.
Original Mortgage
$130,675
Interest Rate
7.95%
Mortgage Type
Purchase Money Mortgage
Purchase Details
Closed on
Apr 1, 2004
Sold by
United States Of America Inc
Bought by
Homeplaces Llc
Create a Home Valuation Report for This Property
The Home Valuation Report is an in-depth analysis detailing your home's value as well as a comparison with similar homes in the area
Purchase History
| Date | Buyer | Sale Price | Title Company |
|---|---|---|---|
| Huang Shaohua | $135,000 | None Available | |
| Champ Barry E | $145,500 | -- | |
| Homeplaces Llc | $616,000 | -- |
Source: Public Records
Mortgage History
| Date | Status | Borrower | Loan Amount |
|---|---|---|---|
| Open | Huang Shaohua | $101,250 | |
| Previous Owner | Champ Barry E | $130,675 |
Source: Public Records
Tax History
| Year | Tax Paid | Tax Assessment Tax Assessment Total Assessment is a certain percentage of the fair market value that is determined by local assessors to be the total taxable value of land and additions on the property. | Land | Improvement |
|---|---|---|---|---|
| 2025 | $3,553 | $404,637 | $150,000 | $254,637 |
| 2024 | $3,474 | $404,637 | $150,000 | $254,637 |
Source: Public Records
Map
Nearby Homes
- 1039 Dual Parks Rd
- 110 Anterbury Dr
- 101 Harbor Haven Dr
- 0-2932 Tingen Rd
- 305 Anterbury Dr
- 1750 Minley Way
- 318 Glaston Ct
- 1434 Salem Creek Dr
- 1614 Brussels Dr
- 120 Licorice Dr
- 102 Licorice Dr
- 203 Milky Way Dr
- 1639 Padstone Dr
- 314 Wrenn St
- 1787 Flint Valley Ln
- 736 Treviso Ln
- 111 Lemon Drop Cir
- 307 S Elm St
- 1840 Flint Valley Ln
- 1008 Daresbury Dr
- 1024 Shackleton Rd
- 1020 Shackleton Rd
- 1018 Shackleton Rd
- 1100 Shackleton Rd
- 1052 Dual Parks Rd
- 0 Shackleton Rd
- 136 Forthview Way
- 134 Forthview Way
- 1016 Shackleton Rd
- 138 Forthview Way
- 140 Forthview Way
- 132 Forthview Way
- 142 Forthview Way
- 144 Forthview Way
- 1050 Dual Parks Rd
- 146 Forthview Way
- 1051 Dual Parks Rd
- 1019 Shackleton Rd
- 1104 Shackleton Rd
- 1017 Shackleton Rd
Your Personal Tour Guide
Ask me questions while you tour the home.