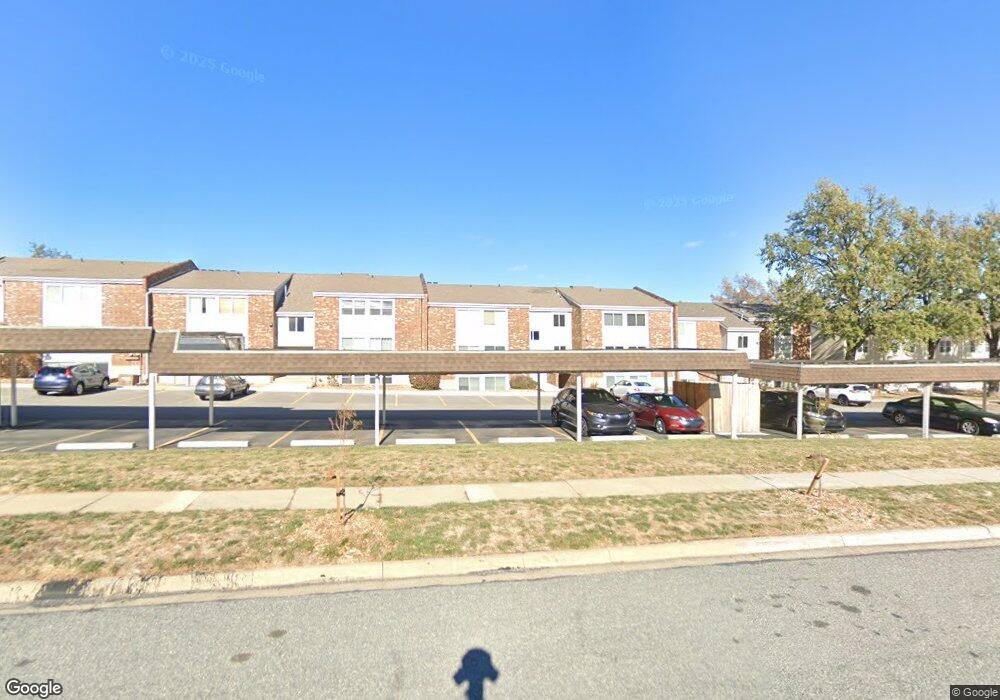
10222 W 96th Terrace Unit C Overland Park, KS 66212
Oak Park NeighborhoodEstimated Value: $182,000 - $195,000
2
Beds
2
Baths
1,168
Sq Ft
$160/Sq Ft
Est. Value
About This Home
This home is located at 10222 W 96th Terrace Unit C, Overland Park, KS 66212 and is currently estimated at $186,456, approximately $159 per square foot. 10222 W 96th Terrace Unit C is a home located in Johnson County with nearby schools including Oak Park-Carpenter Elementary School, Indian Woods Middle School, and Shawnee Mission South High School.
Ownership History
Date
Name
Owned For
Owner Type
Purchase Details
Closed on
Nov 17, 2017
Sold by
Nedzelskiy Eric and Nedzelskiy Alexsandra
Bought by
Kohls Tasha
Current Estimated Value
Purchase Details
Closed on
Jul 13, 2017
Sold by
Nedzelskiy Eric
Bought by
Nedzelskiy Eric and Kohls Tasha
Purchase Details
Closed on
Aug 8, 2013
Sold by
Nedzelskiy Eric and Greenlee Rachel
Bought by
Nedzelskiy Eric
Home Financials for this Owner
Home Financials are based on the most recent Mortgage that was taken out on this home.
Original Mortgage
$84,865
Interest Rate
4.53%
Mortgage Type
Commercial
Purchase Details
Closed on
Sep 25, 2007
Sold by
Malowney Thomas W
Bought by
Nedzelskiy Eric and Greenlee Rachel
Home Financials for this Owner
Home Financials are based on the most recent Mortgage that was taken out on this home.
Original Mortgage
$89,405
Interest Rate
6.48%
Mortgage Type
New Conventional
Create a Home Valuation Report for This Property
The Home Valuation Report is an in-depth analysis detailing your home's value as well as a comparison with similar homes in the area
Home Values in the Area
Average Home Value in this Area
Purchase History
| Date | Buyer | Sale Price | Title Company |
|---|---|---|---|
| Kohls Tasha | -- | None Available | |
| Nedzelskiy Eric | -- | None Available | |
| Nedzelskiy Eric | -- | None Available | |
| Nedzelskiy Eric | -- | Kansas City Title |
Source: Public Records
Mortgage History
| Date | Status | Borrower | Loan Amount |
|---|---|---|---|
| Previous Owner | Nedzelskiy Eric | $84,865 | |
| Previous Owner | Nedzelskiy Eric | $89,405 |
Source: Public Records
Tax History Compared to Growth
Tax History
| Year | Tax Paid | Tax Assessment Tax Assessment Total Assessment is a certain percentage of the fair market value that is determined by local assessors to be the total taxable value of land and additions on the property. | Land | Improvement |
|---|---|---|---|---|
| 2024 | $1,731 | $18,699 | $2,861 | $15,838 |
| 2023 | $1,393 | $14,605 | $2,604 | $12,001 |
| 2022 | $1,229 | $13,018 | $2,262 | $10,756 |
| 2021 | $1,268 | $12,477 | $2,057 | $10,420 |
| 2020 | $1,333 | $13,144 | $1,788 | $11,356 |
| 2019 | $1,344 | $13,259 | $1,788 | $11,471 |
| 2018 | $973 | $11,132 | $1,626 | $9,506 |
| 2017 | $862 | $8,395 | $1,626 | $6,769 |
| 2016 | $845 | $8,096 | $1,626 | $6,470 |
| 2015 | $815 | $8,015 | $1,626 | $6,389 |
| 2013 | -- | $7,268 | $1,626 | $5,642 |
Source: Public Records
Map
Nearby Homes
- 10120 W 96th St Unit A
- 10009 W 95th St
- 10003 W 95th St
- 10185 W 96th Terrace
- 10175 W 96th Terrace
- 9818 Melrose St
- 9841 Melrose St
- 10806 W 96th St
- 9708 W 96th Terrace
- 10000 W 93rd St
- 9432 Carter Dr
- 10624 W 99th St
- 9273 Reeder Dr
- 9216 Wedd Dr
- 9615 W 92nd Terrace
- 9608 W 93rd St
- 10927 W 97th Cir
- 9201 Goddard St
- 9604 Nieman Place
- 11044 W 97th Cir
- 10124 W 96th St Unit C
- 10124 W 96th St Unit B
- 10134 W 96th St Unit A
- 10124 W 96th St Unit D
- 10200 W 96th Terrace Unit C
- 10200 W 96th Terrace Unit E
- 10124 W 96th St Unit 2
- 10200 W 96th Terrace Unit F - 109
- 10140 W 96th Terrace Unit D
- 10134 W 96th St Unit B
- 10124 W 96th St Unit E
- 10200 W 96th Terrace Unit F
- 10204 W 96th Terrace Unit D
- 10140 W 96th Terrace Unit F
- 10204 W 96th Terrace Unit A
- 10204 W 96th Terrace Unit C
- 10140 W 96th Terrace Unit C
- 10200 W 96th Terrace Unit B
- 10200 W 96th Terrace Unit F
- 10200 W 96th Terrace Unit D