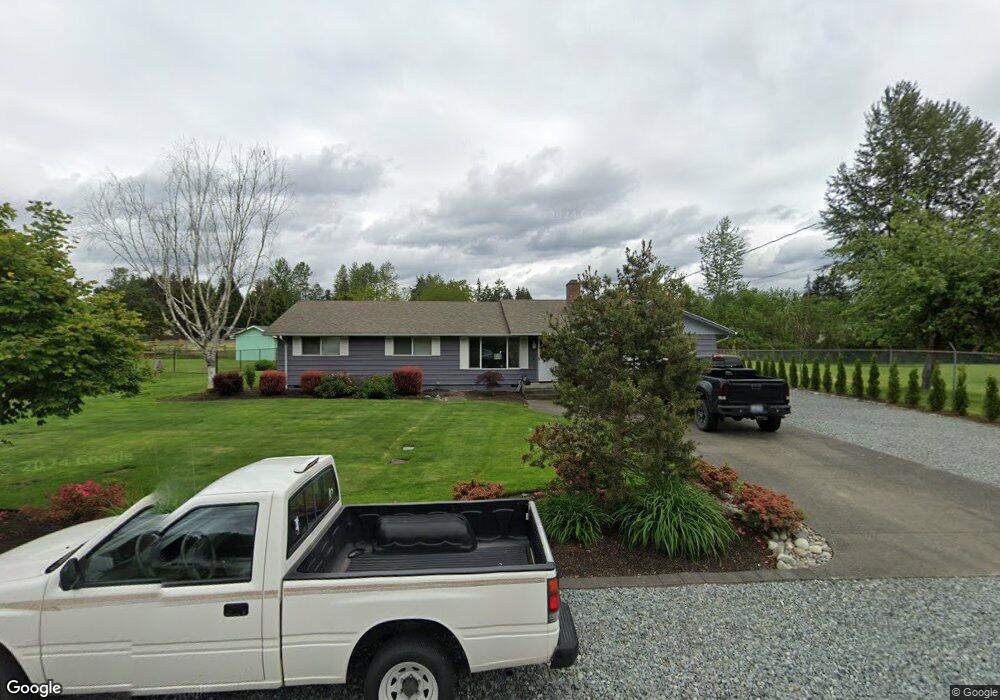
10223 48th Ave E Tacoma, WA 98446
Estimated Value: $508,270 - $692,000
3
Beds
2
Baths
1,536
Sq Ft
$379/Sq Ft
Est. Value
About This Home
This home is located at 10223 48th Ave E, Tacoma, WA 98446 and is currently estimated at $582,068, approximately $378 per square foot. 10223 48th Ave E is a home located in Pierce County with nearby schools including Central Avenue Elementary School, Morris Ford Middle School, and Franklin Pierce High School.
Ownership History
Date
Name
Owned For
Owner Type
Purchase Details
Closed on
Dec 18, 2013
Sold by
Weaver Duane M
Bought by
Stewart Tabitha M
Current Estimated Value
Home Financials for this Owner
Home Financials are based on the most recent Mortgage that was taken out on this home.
Original Mortgage
$204,250
Outstanding Balance
$152,180
Interest Rate
4.13%
Mortgage Type
New Conventional
Estimated Equity
$429,888
Purchase Details
Closed on
Jan 29, 2004
Sold by
Uphaus Daron and Uphaus Kathleen
Bought by
Weaver Duane M
Home Financials for this Owner
Home Financials are based on the most recent Mortgage that was taken out on this home.
Original Mortgage
$142,400
Interest Rate
5.79%
Mortgage Type
Purchase Money Mortgage
Purchase Details
Closed on
Jan 5, 2000
Sold by
Hansen Evelyn G and Hansen Evelyn Genevieve
Bought by
Uphaus Marvin R and Uphaus Sandra L
Purchase Details
Closed on
Feb 13, 1999
Sold by
Uphaus Daron
Bought by
Uphaus Daron and Uphaus Kathleen
Create a Home Valuation Report for This Property
The Home Valuation Report is an in-depth analysis detailing your home's value as well as a comparison with similar homes in the area
Home Values in the Area
Average Home Value in this Area
Purchase History
| Date | Buyer | Sale Price | Title Company |
|---|---|---|---|
| Stewart Tabitha M | $215,000 | First American Title Ins Co | |
| Stewart Tabitha M | $215,000 | First American Title Ins Co | |
| Weaver Duane M | $178,000 | First American Title Ins Co | |
| Uphaus Marvin R | -- | Puget Sound Title Company | |
| Uphaus Daron | -- | -- |
Source: Public Records
Mortgage History
| Date | Status | Borrower | Loan Amount |
|---|---|---|---|
| Open | Stewart Tabitha M | $204,250 | |
| Previous Owner | Weaver Duane M | $142,400 |
Source: Public Records
Tax History
| Year | Tax Paid | Tax Assessment Tax Assessment Total Assessment is a certain percentage of the fair market value that is determined by local assessors to be the total taxable value of land and additions on the property. | Land | Improvement |
|---|---|---|---|---|
| 2025 | $5,089 | $487,900 | $237,900 | $250,000 |
| 2024 | $5,089 | $476,100 | $211,200 | $264,900 |
| 2023 | $5,089 | $437,200 | $211,200 | $226,000 |
| 2022 | $4,854 | $473,500 | $243,000 | $230,500 |
| 2021 | $4,495 | $339,000 | $167,600 | $171,400 |
| 2019 | $3,656 | $312,700 | $144,200 | $168,500 |
| 2018 | $4,176 | $286,000 | $116,000 | $170,000 |
| 2017 | $3,774 | $248,600 | $91,600 | $157,000 |
| 2016 | $3,220 | $198,900 | $73,300 | $125,600 |
| 2014 | $3,122 | $170,900 | $59,500 | $111,400 |
| 2013 | $3,122 | $160,400 | $55,000 | $105,400 |
Source: Public Records
Map
Nearby Homes
- 4514 96th St E
- 4616 96th St E
- 5611 99th Street Ct E Unit 5611
- 9605 52nd Ave E Unit 1-8
- 5726 99th Street Ct E Unit E5726
- 5211 E 96th St
- 9402 48th Ave E
- 9314 Canyon Rd E Unit 85
- 9314 Canyon Rd E Unit 40
- 9314 Canyon Rd E Unit 39
- 9901 59th Avenue Ct E
- 11221 40th Ave E
- 6003 98th St E
- 9012 47th Ave E
- 9431 Pipeline Rd E
- 5702 90th Street Ct E Unit 173
- 6510 102nd St E
- 5902 89th Street Ct E Unit 11
- 6110 91st St E Unit 145
- 6510 109th St E Unit 6510
- 10215 48th Ave E
- 10308 48th Ave E
- 4809 104th St E
- 10220 48th Ave E
- 10206 50th Ave E
- 4715 104th St E
- 4821 104th St E
- 4905 104th St E
- 10123 48th Ave E
- 10312 50th Ave E
- 10401 48th Ave E
- 10314 50th Ave E
- 4812 104th St E
- 4822 104th St E
- 10316 50th Ave E
- 10407 48th Ave E
- 4904 104th St E
- 10124 48th Ave E
- 10219 50th Ave E
- 10419 48th Ave E
Your Personal Tour Guide
Ask me questions while you tour the home.