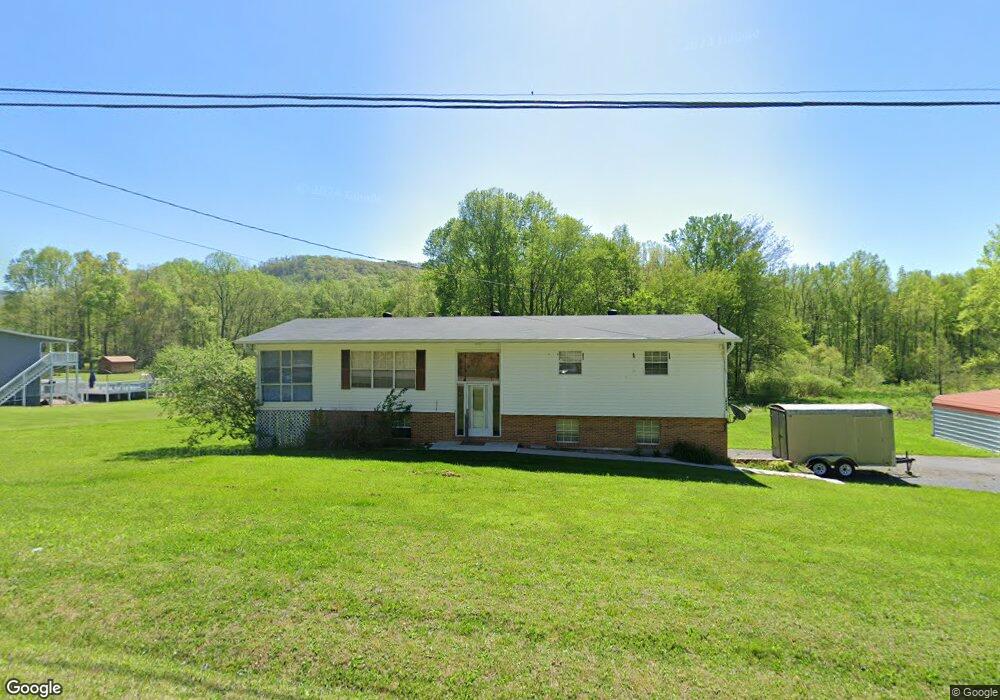
10229 Petros Hwy Unit 10229 Oliver Springs, TN 37840
Estimated Value: $185,428 - $292,000
--
Bed
2
Baths
1,458
Sq Ft
$155/Sq Ft
Est. Value
About This Home
This home is located at 10229 Petros Hwy Unit 10229, Oliver Springs, TN 37840 and is currently estimated at $225,857, approximately $154 per square foot. 10229 Petros Hwy Unit 10229 is a home located in Morgan County with nearby schools including Petros Joyner Elementary School and Coalfield School.
Ownership History
Date
Name
Owned For
Owner Type
Purchase Details
Closed on
Feb 9, 2004
Bought by
Adkisson Brad A
Current Estimated Value
Purchase Details
Closed on
Jan 16, 2003
Bought by
Daugherty Gregory L and Daugherty Inda G
Purchase Details
Closed on
Jul 10, 2001
Bought by
Taylor Wanda
Purchase Details
Closed on
Nov 1, 1991
Bought by
Harness Laford and Harness Ester
Purchase Details
Closed on
Aug 21, 1975
Bought by
Neal Marsie and Ruth Mae
Create a Home Valuation Report for This Property
The Home Valuation Report is an in-depth analysis detailing your home's value as well as a comparison with similar homes in the area
Home Values in the Area
Average Home Value in this Area
Purchase History
| Date | Buyer | Sale Price | Title Company |
|---|---|---|---|
| Adkisson Brad A | $92,000 | -- | |
| Daugherty Gregory L | $82,800 | -- | |
| Taylor Wanda | $83,000 | -- | |
| Harness Laford | $69,900 | -- | |
| Neal Marsie | -- | -- |
Source: Public Records
Tax History Compared to Growth
Tax History
| Year | Tax Paid | Tax Assessment Tax Assessment Total Assessment is a certain percentage of the fair market value that is determined by local assessors to be the total taxable value of land and additions on the property. | Land | Improvement |
|---|---|---|---|---|
| 2024 | $824 | $30,300 | $5,325 | $24,975 |
| 2023 | $820 | $30,150 | $5,325 | $24,825 |
| 2022 | $820 | $30,150 | $5,325 | $24,825 |
| 2021 | $820 | $30,150 | $5,325 | $24,825 |
| 2020 | $874 | $30,150 | $5,325 | $24,825 |
| 2019 | $874 | $26,725 | $5,250 | $21,475 |
| 2018 | $874 | $26,725 | $5,250 | $21,475 |
| 2017 | $845 | $26,725 | $5,250 | $21,475 |
| 2016 | $845 | $26,725 | $5,250 | $21,475 |
| 2015 | $828 | $26,725 | $5,250 | $21,475 |
| 2014 | $868 | $28,000 | $5,825 | $22,175 |
| 2013 | $868 | $28,008 | $0 | $0 |
Source: Public Records
Map
Nearby Homes
- 9533 Petros Hwy
- 103 Duncan Woods Rd
- 125 Gill Burgess Rd
- 4716 Knoxville Hwy
- 155 Mountain Vista Rd
- 225 Meadow Dr
- 183 Meadow Dr
- 117 & 119 E C Noe Rd
- 2992 Knoxville Hwy
- 213 Cedar Ridge Rd
- 0 Petit Ln
- 778 Cassell Rd
- 322 Spruce Dr
- 1534 Cove Ln
- 1384 Coal Hill Rd
- 118 Jones Rd
- 2919 Morgan County Hwy
- 118 Authorn Sheldon Rd
- 0000 Ray Cross Rd
- Tr 1 Hollow Ct
- 10217 Petros Hwy Unit 10217
- 10222 Petros Hwy Unit 10222
- 10034 Petros Hwy Unit 10034
- 10208 Petros Hwy
- 0 St Rt 116 Tn Unit RTC2849561
- 0 St Rt 116 Tn Unit 1089748
- 10205 Petros Hwy Unit 10205
- 116 Water Tank Rd
- 104 Water Tank Rd
- 141 Water Tank Rd
- 10304 Petros Hwy
- 10305 Petros Hwy
- 10315 Petros Hwy Unit 10315
- 10108 Petros Hwy
- 10303 Petros Hwy Unit 10305
- 10318 Petros Hwy
- 118 Water Tank Rd
- 10112 Petros Hwy
- 10322 Petros Hwy
- 719 Back Petros Rd