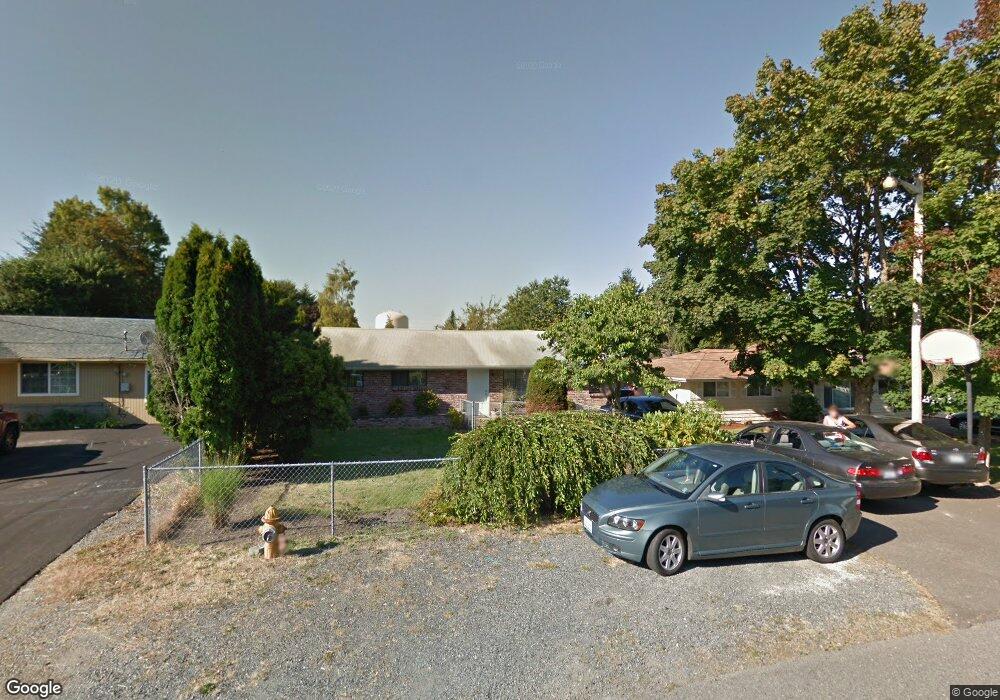
1023 93rd St SW Everett, WA 98204
Westmont NeighborhoodEstimated Value: $540,000 - $730,000
3
Beds
2
Baths
1,730
Sq Ft
$363/Sq Ft
Est. Value
About This Home
This home is located at 1023 93rd St SW, Everett, WA 98204 and is currently estimated at $627,853, approximately $362 per square foot. 1023 93rd St SW is a home located in Snohomish County with nearby schools including Challenger Elementary School, Explorer Middle School, and Mariner High School.
Ownership History
Date
Name
Owned For
Owner Type
Purchase Details
Closed on
Aug 3, 2020
Sold by
Liu Mason R and Liu Edeltraud
Bought by
Gonzalez Carlos D and Gonzalez Danessa
Current Estimated Value
Home Financials for this Owner
Home Financials are based on the most recent Mortgage that was taken out on this home.
Original Mortgage
$358,388
Outstanding Balance
$313,591
Interest Rate
3%
Mortgage Type
FHA
Estimated Equity
$314,262
Purchase Details
Closed on
Aug 13, 2007
Sold by
Ruthruff Verne W and Ruthruff Gloria
Bought by
Liu Mason R and Liu Edeltraud
Purchase Details
Closed on
Aug 23, 2005
Sold by
Brown Michael E and Brown Pamela A
Bought by
Ruthruff Verne W and Ruthruff Gloria
Home Financials for this Owner
Home Financials are based on the most recent Mortgage that was taken out on this home.
Original Mortgage
$58,000
Interest Rate
5.61%
Mortgage Type
Stand Alone Second
Create a Home Valuation Report for This Property
The Home Valuation Report is an in-depth analysis detailing your home's value as well as a comparison with similar homes in the area
Home Values in the Area
Average Home Value in this Area
Purchase History
| Date | Buyer | Sale Price | Title Company |
|---|---|---|---|
| Gonzalez Carlos D | $365,000 | Cw Title | |
| Liu Mason R | $263,059 | Fidelity Natl Title Co Of Wa | |
| Ruthruff Verne W | $290,000 | Pnwt |
Source: Public Records
Mortgage History
| Date | Status | Borrower | Loan Amount |
|---|---|---|---|
| Open | Gonzalez Carlos D | $358,388 | |
| Previous Owner | Ruthruff Verne W | $58,000 | |
| Previous Owner | Ruthruff Verne W | $232,000 |
Source: Public Records
Tax History
| Year | Tax Paid | Tax Assessment Tax Assessment Total Assessment is a certain percentage of the fair market value that is determined by local assessors to be the total taxable value of land and additions on the property. | Land | Improvement |
|---|---|---|---|---|
| 2025 | $4,217 | $564,000 | $371,000 | $193,000 |
| 2024 | $4,217 | $531,100 | $335,000 | $196,100 |
| 2023 | $4,594 | $593,400 | $356,000 | $237,400 |
| 2022 | $4,134 | $462,300 | $261,000 | $201,300 |
| 2020 | $3,342 | $374,700 | $198,000 | $176,700 |
| 2019 | $2,899 | $328,500 | $155,000 | $173,500 |
| 2018 | $3,199 | $312,800 | $158,000 | $154,800 |
| 2017 | $2,383 | $237,600 | $136,000 | $101,600 |
| 2016 | $2,187 | $215,600 | $118,000 | $97,600 |
Source: Public Records
Map
Nearby Homes
- 9521 Sharon Dr
- 630 90th St SW Unit A/B
- 1626 93rd Place SW Unit 25
- 9330 16th Dr W Unit 22
- 1427 100th St SW Unit 75
- 1427 100th St SW Unit 160
- 1427 100th St SW Unit 57
- 1427 100th St SW Unit 149
- 1427 100th St SW Unit 27
- 1427 100th St SW Unit 145
- 1427 100th St SW Unit 154
- 1427 100th St SW Unit 127
- 1427 100th St SW Unit 67
- 9815 Holly Dr Unit A103
- 9917 Holly Dr Unit B307
- 9815 Holly Dr Unit A208
- 1430 W Casino Rd Unit 63
- 1430 W Casino Rd Unit 272
- 9202 18th Ave W
- 226 93rd Place SW Unit 8
- 1017 93rd St SW
- 1029 93rd St SW
- 1011 93rd St SW
- 1103 93rd St SW
- 1018 91st Place SW
- 1005 93rd St SW
- 9121 11th Place W
- 9126 10th Place W
- 1109 93rd St SW
- 9125 11th Place W
- 1012 91st Place SW
- 9129 11th Place W
- 931 93rd St SW
- 9615 11th Place W
- 9305 11th Ave W
- 1115 93rd St SW
- 9133 11th Place W
- 1022 93rd St SW
- 1028 93rd St SW
- 1004 91st Place SW
Your Personal Tour Guide
Ask me questions while you tour the home.