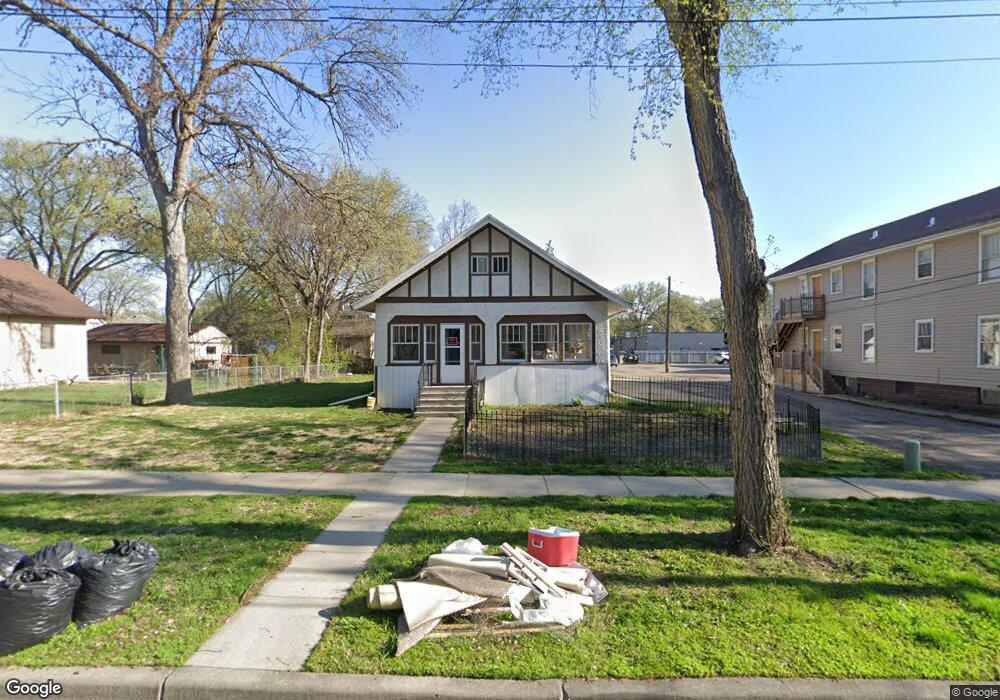
1023 9th Ave S Fargo, ND 58103
Hawthorne NeighborhoodEstimated Value: $198,000 - $239,845
3
Beds
2
Baths
1,864
Sq Ft
$115/Sq Ft
Est. Value
About This Home
This home is located at 1023 9th Ave S, Fargo, ND 58103 and is currently estimated at $215,211, approximately $115 per square foot. 1023 9th Ave S is a home located in Cass County with nearby schools including Clara Barton Elementary School, Ben Franklin Middle School, and South High School.
Ownership History
Date
Name
Owned For
Owner Type
Purchase Details
Closed on
Apr 30, 2020
Sold by
Nhb Properties Llc
Bought by
Budge John and Budge Amy
Current Estimated Value
Home Financials for this Owner
Home Financials are based on the most recent Mortgage that was taken out on this home.
Original Mortgage
$151,905
Outstanding Balance
$135,357
Interest Rate
3.6%
Mortgage Type
New Conventional
Estimated Equity
$79,854
Purchase Details
Closed on
Dec 17, 2019
Sold by
Nhb Properties Llc
Bought by
Anderson Nate
Purchase Details
Closed on
Dec 18, 2018
Sold by
Lane Harvey and Harvey Lane Revocable Living T
Bought by
Nhb Properties Llc
Home Financials for this Owner
Home Financials are based on the most recent Mortgage that was taken out on this home.
Original Mortgage
$206,353
Interest Rate
4.9%
Mortgage Type
Commercial
Create a Home Valuation Report for This Property
The Home Valuation Report is an in-depth analysis detailing your home's value as well as a comparison with similar homes in the area
Home Values in the Area
Average Home Value in this Area
Purchase History
| Date | Buyer | Sale Price | Title Company |
|---|---|---|---|
| Budge John | $159,900 | Regency Title Fargo | |
| Nhb Properties Llc | -- | Regency Title Fargo | |
| Anderson Nate | -- | Fm Title | |
| Nhb Properties Llc | $215,000 | Fm Title |
Source: Public Records
Mortgage History
| Date | Status | Borrower | Loan Amount |
|---|---|---|---|
| Open | Budge John | $151,905 | |
| Previous Owner | Nhb Properties Llc | $206,353 |
Source: Public Records
Tax History Compared to Growth
Tax History
| Year | Tax Paid | Tax Assessment Tax Assessment Total Assessment is a certain percentage of the fair market value that is determined by local assessors to be the total taxable value of land and additions on the property. | Land | Improvement |
|---|---|---|---|---|
| 2024 | $3,171 | $98,300 | $27,650 | $70,650 |
| 2023 | $3,009 | $92,750 | $27,650 | $65,100 |
| 2022 | $2,937 | $88,350 | $27,650 | $60,700 |
| 2021 | $2,729 | $82,200 | $27,650 | $54,550 |
| 2020 | $2,701 | $82,200 | $27,650 | $54,550 |
| 2019 | $2,189 | $61,500 | $15,350 | $46,150 |
| 2018 | $2,137 | $61,500 | $15,350 | $46,150 |
| 2017 | $2,074 | $59,700 | $15,350 | $44,350 |
| 2016 | $2,264 | $74,450 | $15,350 | $59,100 |
| 2015 | $1,978 | $58,450 | $11,500 | $46,950 |
| 2014 | $1,904 | $54,100 | $11,500 | $42,600 |
| 2013 | $1,823 | $51,500 | $11,500 | $40,000 |
Source: Public Records
Map
Nearby Homes
- 1020 9th Ave S
- 820 10th St S Unit C20
- 1118 8th Ave S
- 910 University Dr S
- 911 8th St S
- 601 10th St S
- 513 10th St S
- 1112 University Dr S
- 1124 University Dr S
- 1124 5th Ave S
- 505 8th St S
- 1208 University Dr S
- 605 7th St S Unit 2
- 502 8th St S Unit 5
- 502 8th St S Unit 3
- 502 8th St S Unit 1
- 502 8th St S Unit 2
- 502 8th St S Unit 4
- 1414 10th Ave S
- 1301 10th St S