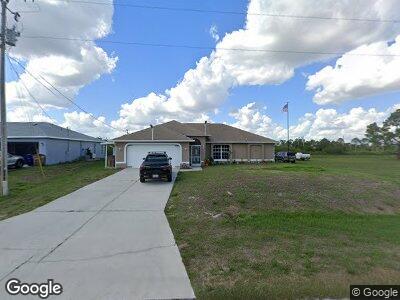
1023 Bandera St Unit 16 Lehigh Acres, FL 33974
Eisenhower NeighborhoodEstimated Value: $280,000 - $321,000
3
Beds
2
Baths
1,476
Sq Ft
$199/Sq Ft
Est. Value
About This Home
This home is located at 1023 Bandera St Unit 16, Lehigh Acres, FL 33974 and is currently estimated at $293,404, approximately $198 per square foot. 1023 Bandera St Unit 16 is a home located in Lee County with nearby schools including Lehigh Elementary School, Gateway Elementary School, and The Alva School.
Ownership History
Date
Name
Owned For
Owner Type
Purchase Details
Closed on
Aug 16, 2018
Sold by
Hartley Bobby M
Bought by
Edwards Dennis Louis
Current Estimated Value
Purchase Details
Closed on
May 21, 2015
Sold by
Hartley Bobby M
Bought by
Hartley Bobbie M and Regnier Madalene Louise
Purchase Details
Closed on
Aug 20, 2009
Sold by
Fifth Third Mortgage Company
Bought by
Hartley Bobby
Purchase Details
Closed on
Sep 29, 2008
Sold by
Krishnan Radha
Bought by
Fifth Third Mortgage Co
Purchase Details
Closed on
Oct 27, 2004
Sold by
Diversified Holdings Group Llc
Bought by
Krishnan Radha
Home Financials for this Owner
Home Financials are based on the most recent Mortgage that was taken out on this home.
Original Mortgage
$152,125
Interest Rate
5.77%
Mortgage Type
Unknown
Purchase Details
Closed on
Jun 10, 2004
Sold by
Mcclanahan Arthur T
Bought by
Chris Properties Llc
Purchase Details
Closed on
Sep 18, 1998
Sold by
Mcclanahan Arthur T and Mcclanahan Marilyn J
Bought by
Mcclanahan Arthur T
Create a Home Valuation Report for This Property
The Home Valuation Report is an in-depth analysis detailing your home's value as well as a comparison with similar homes in the area
Home Values in the Area
Average Home Value in this Area
Purchase History
| Date | Buyer | Sale Price | Title Company |
|---|---|---|---|
| Edwards Dennis Louis | $165,000 | Attorney | |
| Hartley Bobbie M | -- | Attorney | |
| Hartley Bobby M | -- | Attorney | |
| Hartley Bobby | $48,000 | Fidelity National Title Ins | |
| Fifth Third Mortgage Co | -- | None Available | |
| Krishnan Radha | $20,000 | Covenant Title Inc | |
| Chris Properties Llc | $6,000 | Classic Title Services Inc | |
| Mcclanahan Arthur T | -- | -- |
Source: Public Records
Mortgage History
| Date | Status | Borrower | Loan Amount |
|---|---|---|---|
| Previous Owner | Krishnan Radha | $159,800 | |
| Previous Owner | Krishnan Radha | $152,125 | |
| Closed | Edwards Dennis Louis | $0 |
Source: Public Records
Tax History Compared to Growth
Tax History
| Year | Tax Paid | Tax Assessment Tax Assessment Total Assessment is a certain percentage of the fair market value that is determined by local assessors to be the total taxable value of land and additions on the property. | Land | Improvement |
|---|---|---|---|---|
| 2024 | $2,189 | $171,542 | -- | -- |
| 2023 | $2,336 | $166,196 | $0 | $0 |
| 2022 | $2,189 | $160,612 | $0 | $0 |
| 2021 | $2,096 | $156,058 | $8,500 | $147,558 |
| 2020 | $2,363 | $139,696 | $3,750 | $135,946 |
| 2019 | $2,348 | $134,044 | $3,700 | $130,344 |
| 2018 | $1,989 | $118,706 | $3,700 | $115,006 |
| 2017 | $1,918 | $116,271 | $4,000 | $112,271 |
| 2016 | $1,744 | $97,912 | $4,000 | $93,912 |
| 2015 | $1,595 | $83,595 | $2,900 | $80,695 |
| 2014 | -- | $75,992 | $2,585 | $73,407 |
| 2013 | -- | $61,398 | $2,200 | $59,198 |
Source: Public Records
Map
Nearby Homes
- 1030 Capetown Ave
- 1028 Capetown Ave
- 1028 Capetown Ave
- 1026 Capetown Ave
- 1022 Capetown Ave
- 1024 Brenton Ave
- 941 Capetown Ave
- 1021 Eubanks St
- 1016 Arbordale St
- 1040 Countess Ave
- 1050 Eisenhower Blvd
- 1043 Brenton Ave
- 1046 Eisenhower Blvd
- 1085 Eisenhower Blvd
- 1037 Hobart St Unit 21
- 1045 Hobart St
- 1015 Countess Ave
- 1027 Albion St
- 1042 Hobart St
- 1036 Genoa Ave S
- 1023 Bandera St Unit 16
- 1025 Bandera St
- 1019 Bandera St
- 1020 Berwick St
- 1020 Bandera St Unit 15
- 1018 Bandera St Unit 15
- 1025 Durand St
- 1034 Capetown Ave
- 1024 Berwick St
- 1040 Berwick St
- 1019 Durand St
- 1030 Bandera St
- 1021 Berwick St
- 1019 Berwick St
- 1073 Countess Ave Unit 15
- 1040 Capetown Ave
- 1032 Bandera St
- 1063 Countess Ave
- 1022 Durand St
- 1024 Durand St