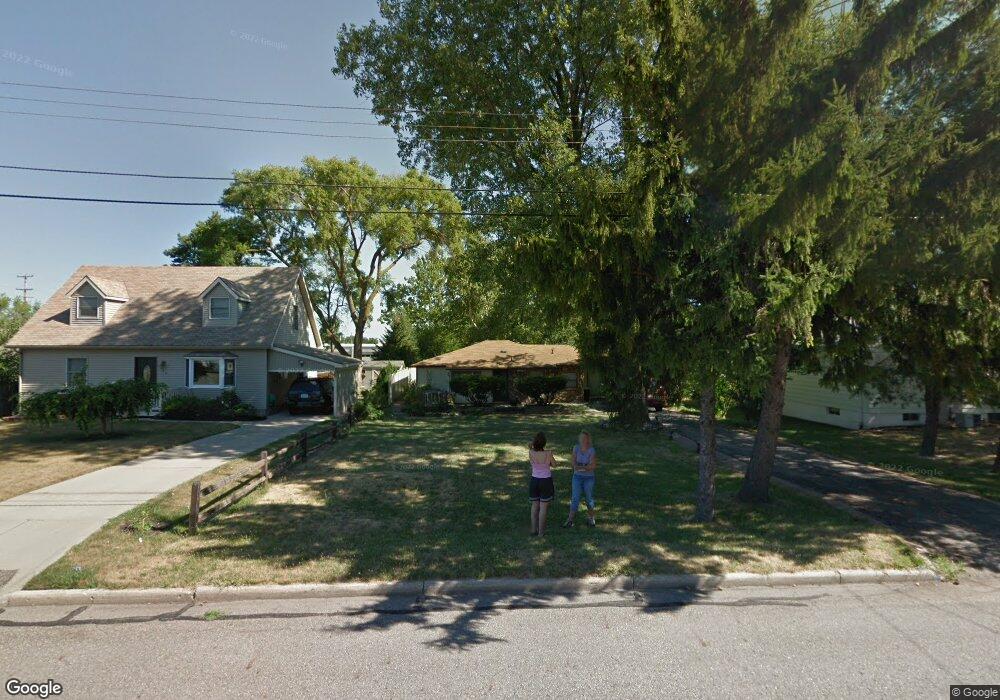
1023 Dennis St Lansing, MI 48911
South Lansing NeighborhoodEstimated Value: $125,000 - $165,000
3
Beds
1
Bath
1,166
Sq Ft
$127/Sq Ft
Est. Value
About This Home
This home is located at 1023 Dennis St, Lansing, MI 48911 and is currently estimated at $147,941, approximately $126 per square foot. 1023 Dennis St is a home located in Ingham County with nearby schools including Forest View School, Attwood School, and Everett High School.
Ownership History
Date
Name
Owned For
Owner Type
Purchase Details
Closed on
Dec 2, 2020
Sold by
Escobedo Raul
Bought by
Escobedo Raul and Sauceda Maria
Current Estimated Value
Purchase Details
Closed on
Apr 27, 2001
Sold by
Anglebrandt Marilu and Anglebrandt Michael L
Bought by
Escobedo Raul and Vallejo Patricia K
Home Financials for this Owner
Home Financials are based on the most recent Mortgage that was taken out on this home.
Original Mortgage
$53,100
Interest Rate
7.16%
Mortgage Type
Purchase Money Mortgage
Create a Home Valuation Report for This Property
The Home Valuation Report is an in-depth analysis detailing your home's value as well as a comparison with similar homes in the area
Home Values in the Area
Average Home Value in this Area
Purchase History
| Date | Buyer | Sale Price | Title Company |
|---|---|---|---|
| Escobedo Raul | -- | None Available | |
| Escobedo Raul | $66,400 | -- |
Source: Public Records
Mortgage History
| Date | Status | Borrower | Loan Amount |
|---|---|---|---|
| Previous Owner | Escobedo Raul | $53,100 |
Source: Public Records
Tax History Compared to Growth
Tax History
| Year | Tax Paid | Tax Assessment Tax Assessment Total Assessment is a certain percentage of the fair market value that is determined by local assessors to be the total taxable value of land and additions on the property. | Land | Improvement |
|---|---|---|---|---|
| 2025 | $2,372 | $62,300 | $9,700 | $52,600 |
| 2024 | $19 | $51,200 | $9,700 | $41,500 |
| 2023 | $2,225 | $46,900 | $9,700 | $37,200 |
| 2022 | $2,008 | $40,300 | $9,100 | $31,200 |
| 2021 | $1,967 | $37,100 | $6,200 | $30,900 |
| 2020 | $2,499 | $35,600 | $6,200 | $29,400 |
| 2019 | $2,415 | $34,100 | $6,200 | $27,900 |
| 2018 | $2,289 | $31,400 | $6,200 | $25,200 |
| 2017 | $2,204 | $31,400 | $6,200 | $25,200 |
| 2016 | $2,116 | $30,900 | $6,200 | $24,700 |
| 2015 | $2,116 | $30,000 | $12,471 | $17,529 |
| 2014 | $2,116 | $28,100 | $15,588 | $12,512 |
Source: Public Records
Map
Nearby Homes
- 1101 Barr Ave
- 4901 Allison Dr
- 5724 Orchard Ct
- 4733 S Pennsylvania Ave
- 4901 Southgate Ave
- 5750 Orchard Ct
- 5808 Orchard Ct
- 5752 Joshua St
- 0 N Aurelius Rd
- 0 Glenwood Ave
- 629 Emily Ave
- 600 E Cavanaugh Rd
- 201 E Syringa Dr
- 2018 Worden St
- 4317 S Cedar St
- 629 Jessop Ave
- 354 E Miller Rd
- 527 E Cavanaugh Rd
- 1121 Maplehill Ave
- 105 Cox Blvd