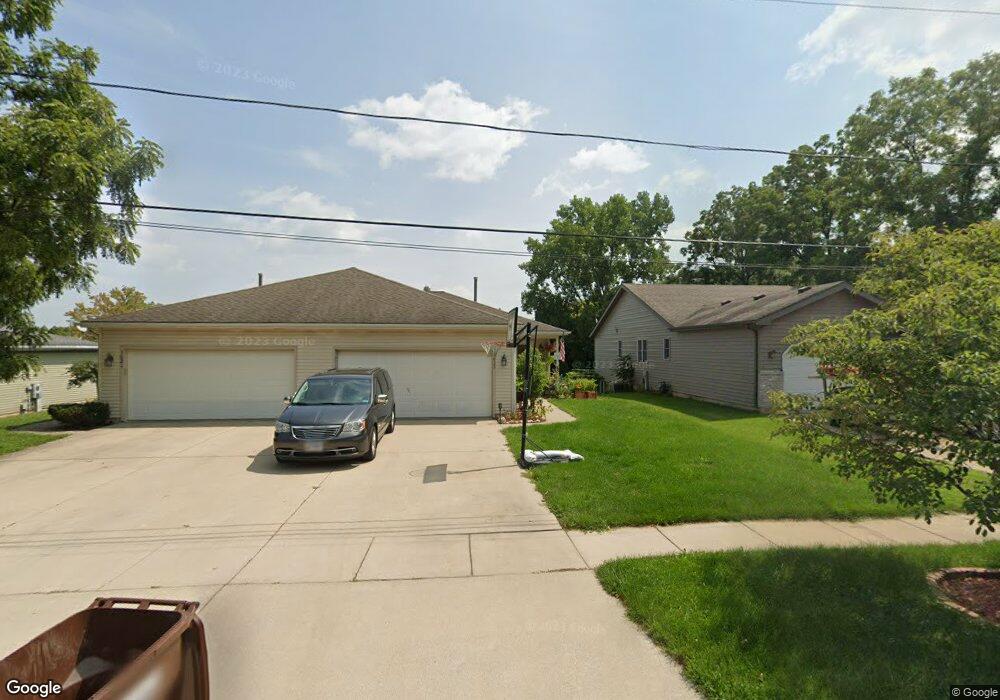
1023 Dietz St Marengo, IL 60152
Estimated Value: $269,000 - $297,000
5
Beds
2
Baths
1,410
Sq Ft
$201/Sq Ft
Est. Value
About This Home
This home is located at 1023 Dietz St, Marengo, IL 60152 and is currently estimated at $283,473, approximately $201 per square foot. 1023 Dietz St is a home located in McHenry County with nearby schools including Riley Community Consolidated School District 18, Marengo Community High School, and Zion Lutheran School.
Ownership History
Date
Name
Owned For
Owner Type
Purchase Details
Closed on
Sep 18, 2020
Sold by
Tegeler Brent C
Bought by
Bratanick Jason E and Bratanickh Jennifer M
Current Estimated Value
Home Financials for this Owner
Home Financials are based on the most recent Mortgage that was taken out on this home.
Original Mortgage
$149,737
Interest Rate
2.7%
Mortgage Type
FHA
Purchase Details
Closed on
May 8, 2009
Sold by
Brackmann James A and Brackmann Joanne
Bought by
Tegeler Brent C
Home Financials for this Owner
Home Financials are based on the most recent Mortgage that was taken out on this home.
Original Mortgage
$115,200
Interest Rate
4.85%
Mortgage Type
Unknown
Purchase Details
Closed on
Jan 30, 2008
Sold by
Brackamann James A and Brackmann Joanne
Bought by
Brackmann James A and Brackmann Joanne
Create a Home Valuation Report for This Property
The Home Valuation Report is an in-depth analysis detailing your home's value as well as a comparison with similar homes in the area
Home Values in the Area
Average Home Value in this Area
Purchase History
| Date | Buyer | Sale Price | Title Company |
|---|---|---|---|
| Bratanick Jason E | -- | First American Title | |
| Tegeler Brent C | $144,000 | Chicago Title Insurance Co | |
| Brackmann James A | -- | None Available |
Source: Public Records
Mortgage History
| Date | Status | Borrower | Loan Amount |
|---|---|---|---|
| Previous Owner | Bratanick Jason E | $149,737 | |
| Previous Owner | Tegeler Brent C | $115,200 |
Source: Public Records
Tax History Compared to Growth
Tax History
| Year | Tax Paid | Tax Assessment Tax Assessment Total Assessment is a certain percentage of the fair market value that is determined by local assessors to be the total taxable value of land and additions on the property. | Land | Improvement |
|---|---|---|---|---|
| 2024 | $4,686 | $79,148 | $7,382 | $71,766 |
| 2023 | $5,016 | $64,715 | $6,578 | $58,137 |
| 2022 | $5,074 | $59,339 | $6,032 | $53,307 |
| 2021 | $3,749 | $54,979 | $5,589 | $49,390 |
| 2020 | $4,677 | $51,975 | $5,284 | $46,691 |
| 2019 | $4,951 | $49,746 | $5,057 | $44,689 |
| 2018 | $4,684 | $47,875 | $3,890 | $43,985 |
| 2017 | $4,600 | $46,278 | $3,760 | $42,518 |
| 2016 | $4,534 | $44,515 | $3,617 | $40,898 |
| 2013 | -- | $30,458 | $6,409 | $24,049 |
Source: Public Records
Map
Nearby Homes
- 832 Oak Manor Dr
- 615 Park Dr
- 422 Damen St
- 6211 Maple St Unit 501
- 704 Echo (Lot 21) Trail
- 806 Echo (Lot 22) Trail
- 7 ACRES Menge Rd
- 802 Echo (Lot 23) Trail
- 455 Park Dr
- 0 Maple St
- 479 Kennedy St
- 459 Kennedy St
- 579 Johnson St
- 10 ac U S 20
- 0 Ratfield Rd
- 720 Cloverleaf Dr
- 730 Cloverleaf Dr
- 725 Cloverleaf Dr
- 6212 Meyer Rd
- 214 S Prospect St
- 1023 Dietz St Unit 2
- 1021 Dietz St
- 1031 Dietz St
- 1033 Dietz St
- 1011 Dietz St
- 1015 Jacquelyn Ct
- 385 South St
- 395 Barbara Ct
- 397 Barbara Ct
- 375 South St
- 1025 Jacquelyn Ct
- 928 Dietz St
- 1005 Jacquelyn Ct
- 430 Barbara Ct
- 400 Barbara Ct
- 1018 Jacquelyn Ct
- 904 Dietz St
- 384 South St Unit 384
- 1006 Jacquelyn Ct
- 1012 Jacquelyn Ct