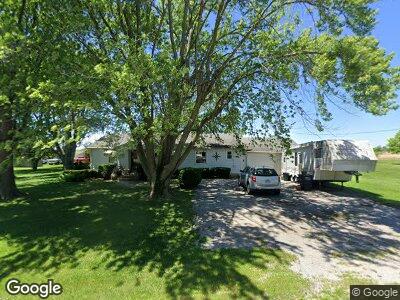
1023 Franklin St Pocahontas, IL 62275
Estimated Value: $53,313 - $111,000
3
Beds
2
Baths
1,450
Sq Ft
$59/Sq Ft
Est. Value
About This Home
This home is located at 1023 Franklin St, Pocahontas, IL 62275 and is currently estimated at $85,328, approximately $58 per square foot. 1023 Franklin St is a home located in Bond County with nearby schools including Bond County Community Unit 2 High School.
Ownership History
Date
Name
Owned For
Owner Type
Purchase Details
Closed on
Jul 31, 2013
Sold by
Mettler Orville E
Bought by
Massey Gregory A and Massey Rhonda K
Current Estimated Value
Purchase Details
Closed on
Mar 1, 2013
Sold by
Lintzenich Dawn
Bought by
Mettler Orville E
Purchase Details
Closed on
Dec 9, 2008
Sold by
Lintzenich James and Lintzenich Dawn
Bought by
Mettler Orville E
Create a Home Valuation Report for This Property
The Home Valuation Report is an in-depth analysis detailing your home's value as well as a comparison with similar homes in the area
Home Values in the Area
Average Home Value in this Area
Purchase History
| Date | Buyer | Sale Price | Title Company |
|---|---|---|---|
| Massey Gregory A | $15,000 | -- | |
| Mettler Orville E | -- | -- | |
| Mettler Orville E | -- | -- | |
| Mettler Orville E | -- | -- |
Source: Public Records
Mortgage History
| Date | Status | Borrower | Loan Amount |
|---|---|---|---|
| Open | Massey Rhonda | $20,000 | |
| Closed | Massey Gregory A | $25,000 | |
| Closed | Massey Gregory A | $7,500 | |
| Closed | Massey Gregory A | $5,000 | |
| Closed | Mettler Orville E | -- |
Source: Public Records
Tax History Compared to Growth
Tax History
| Year | Tax Paid | Tax Assessment Tax Assessment Total Assessment is a certain percentage of the fair market value that is determined by local assessors to be the total taxable value of land and additions on the property. | Land | Improvement |
|---|---|---|---|---|
| 2023 | $189 | $10,936 | $3,105 | $7,831 |
| 2022 | $191 | $10,337 | $2,935 | $7,402 |
| 2021 | $192 | $8,805 | $2,500 | $6,305 |
| 2020 | $199 | $5,937 | $2,500 | $3,437 |
| 2019 | $202 | $5,937 | $2,500 | $3,437 |
| 2018 | $207 | $5,937 | $2,500 | $3,437 |
| 2016 | $211 | $5,937 | $2,500 | $3,437 |
| 2015 | $205 | $5,937 | $2,500 | $3,437 |
| 2013 | $71 | $8,250 | $4,000 | $4,250 |
| 2011 | $1,226 | $15,266 | $4,006 | $11,260 |
Source: Public Records
Map
Nearby Homes