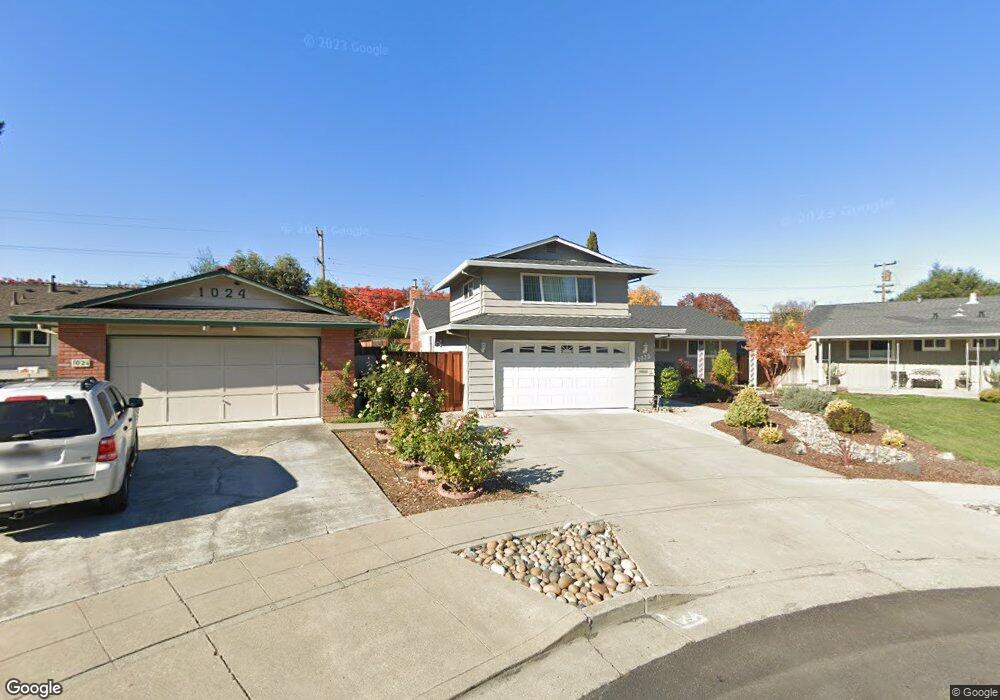
1023 Ingram Ct Sunnyvale, CA 94087
Estimated Value: $2,242,000 - $3,075,000
4
Beds
2
Baths
1,707
Sq Ft
$1,622/Sq Ft
Est. Value
About This Home
This home is located at 1023 Ingram Ct, Sunnyvale, CA 94087 and is currently estimated at $2,768,894, approximately $1,622 per square foot. 1023 Ingram Ct is a home located in Santa Clara County with nearby schools including Cherry Chase Elementary School, Sunnyvale Middle School, and Homestead High School.
Ownership History
Date
Name
Owned For
Owner Type
Purchase Details
Closed on
Feb 28, 2018
Sold by
Roome Kathy B
Bought by
Buranzon Kathy and The Kathy Buranzon Revocable T
Current Estimated Value
Purchase Details
Closed on
Sep 4, 2002
Sold by
Roome Kathy B
Bought by
Roome Kathy B
Home Financials for this Owner
Home Financials are based on the most recent Mortgage that was taken out on this home.
Original Mortgage
$200,000
Interest Rate
6.37%
Purchase Details
Closed on
Feb 6, 1995
Sold by
Roome William R
Bought by
Roome Kathy B
Create a Home Valuation Report for This Property
The Home Valuation Report is an in-depth analysis detailing your home's value as well as a comparison with similar homes in the area
Purchase History
| Date | Buyer | Sale Price | Title Company |
|---|---|---|---|
| Buranzon Kathy | -- | None Available | |
| Roome Kathy B | -- | Financial Title Company | |
| Roome Kathy B | $40,000 | -- |
Source: Public Records
Mortgage History
| Date | Status | Borrower | Loan Amount |
|---|---|---|---|
| Previous Owner | Roome Kathy B | $200,000 |
Source: Public Records
Tax History
| Year | Tax Paid | Tax Assessment Tax Assessment Total Assessment is a certain percentage of the fair market value that is determined by local assessors to be the total taxable value of land and additions on the property. | Land | Improvement |
|---|---|---|---|---|
| 2025 | $6,547 | $560,874 | $336,527 | $224,347 |
| 2024 | $6,547 | $549,878 | $329,929 | $219,949 |
| 2023 | $6,487 | $539,097 | $323,460 | $215,637 |
| 2022 | $6,380 | $528,527 | $317,118 | $211,409 |
| 2021 | $6,317 | $518,164 | $310,900 | $207,264 |
| 2020 | $6,239 | $512,852 | $307,713 | $205,139 |
| 2019 | $6,101 | $502,797 | $301,680 | $201,117 |
| 2018 | $5,994 | $492,939 | $295,765 | $197,174 |
| 2017 | $5,916 | $483,274 | $289,966 | $193,308 |
| 2016 | $5,684 | $473,799 | $284,281 | $189,518 |
| 2015 | $5,715 | $466,683 | $280,011 | $186,672 |
| 2014 | $5,605 | $457,542 | $274,526 | $183,016 |
Source: Public Records
Map
Nearby Homes
- 1018 Blair Ave
- 745 Reseda Dr
- 1033 Crestview Dr Unit 308
- 1033 Crestview Dr Unit 207
- 1204 Blackberry Terrace
- 541 Holthouse Terrace
- 1283 Pumpkin Terrace
- 377 S Mary Ave
- 1203 Hollenbeck Ave
- 1096 W Mckinley Ave
- 1189 Vanderbilt Ct E
- 560 Hyannis Dr
- 538 S Mathilda Ave Unit 301
- 2784 Doverton Square
- 3352 Villa Robleda Dr
- 3411 Shady Spring Ln
- 1035 Fuller Terrace
- 1264 Brookings Ln
- 1090 Butte Ct
- 136 S Mary Ave
- 1019 Ingram Ct
- 1024 Ingram Ct
- 892 Mango Ave
- 888 Mango Ave
- 896 Mango Ave
- 1015 Ingram Ct
- 1020 Ingram Ct
- 884 Mango Ave
- 898 Mango Ave
- 1016 Ingram Ct
- 1022 Hiawatha Ct
- 1026 Hiawatha Ct
- 859 Maranta Ave
- 880 Mango Ave
- 855 Maranta Ave
- 904 Mango Ave
- 865 Maranta Ave
- 1035 Kenbridge Ct
- 1031 Kenbridge Ct
- 869 Maranta Ave
Your Personal Tour Guide
Ask me questions while you tour the home.